
Lab Example: An e-commerce store
In todays data-driven world, understanding customer behavior is essential for optimizing the online shopping experience. This lab focuses on a simplified e-commerce store scenario that demonstrates how user interactions can be captured and analyzed using key data entities.
You'll explore a data model consisting of products, product categories, and event tracking—specifically impressions and clicks. These interactions help uncover insights into customer preferences and product performance.
The lab provides examples and real-world context to make the data more relatable and practical. By the end, you will gain hands-on experience in how to build a Fabric Real-Time end-to-end solution to analyze how customers engage with an online storefront—knowledge that is invaluable for making data-informed business decisions.
The e-commerce store database entities are:
- Product: the product catalogue.
- ProductCategory: the product categories.
- events: a click or impression event.
An impression event is logged when a product appears in the search results.
A click event is logged when the product is clicked and the customer has viewed the details.
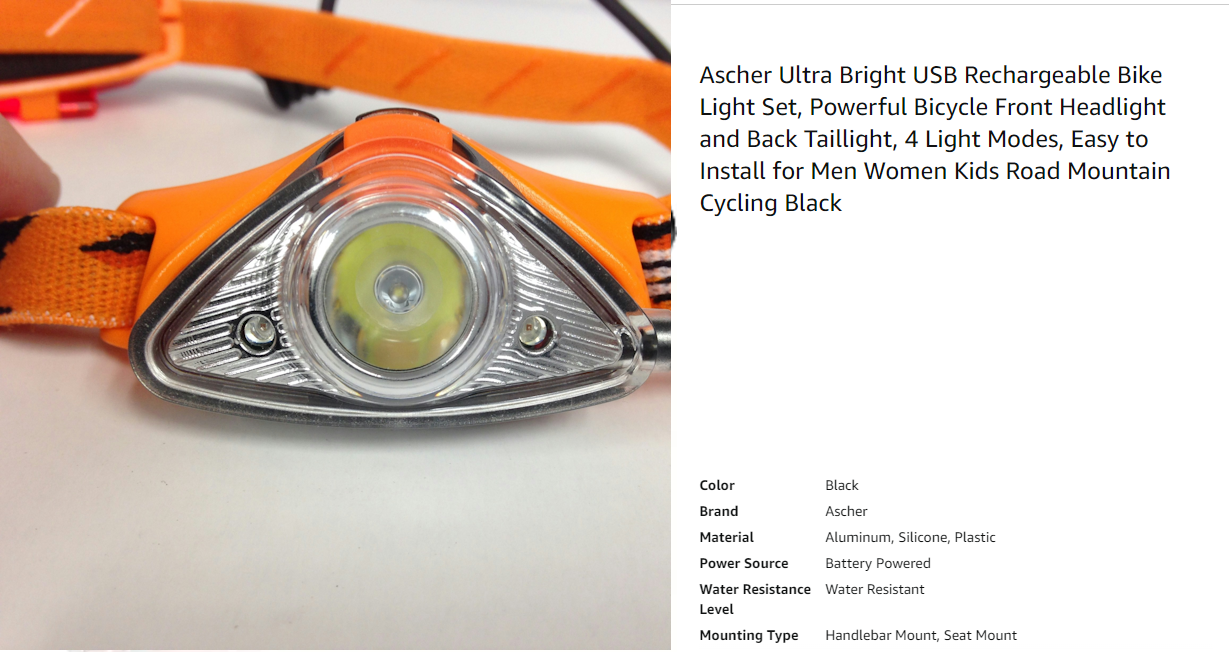
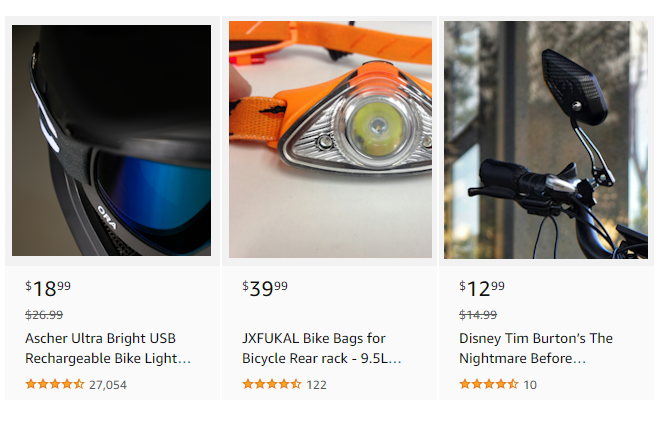
Photo credits: Himiway Bikes, HEAD Accessories, Jan Kopřiva on Unsplash.
1. Login to Lab Environment
Note
Do not use an InPrivate browser window. Recommend using a Personal browser window to successfully run this lab.
- Open app.fabric.microsoft.com in your browser.
- Login with provided credentials, if a trial fabric tenant was previously setup (reference Pre-reqs). You may also choose to run the lab in your own Fabric Tenant if you already have one.
- Click Real-Time Intelligence.
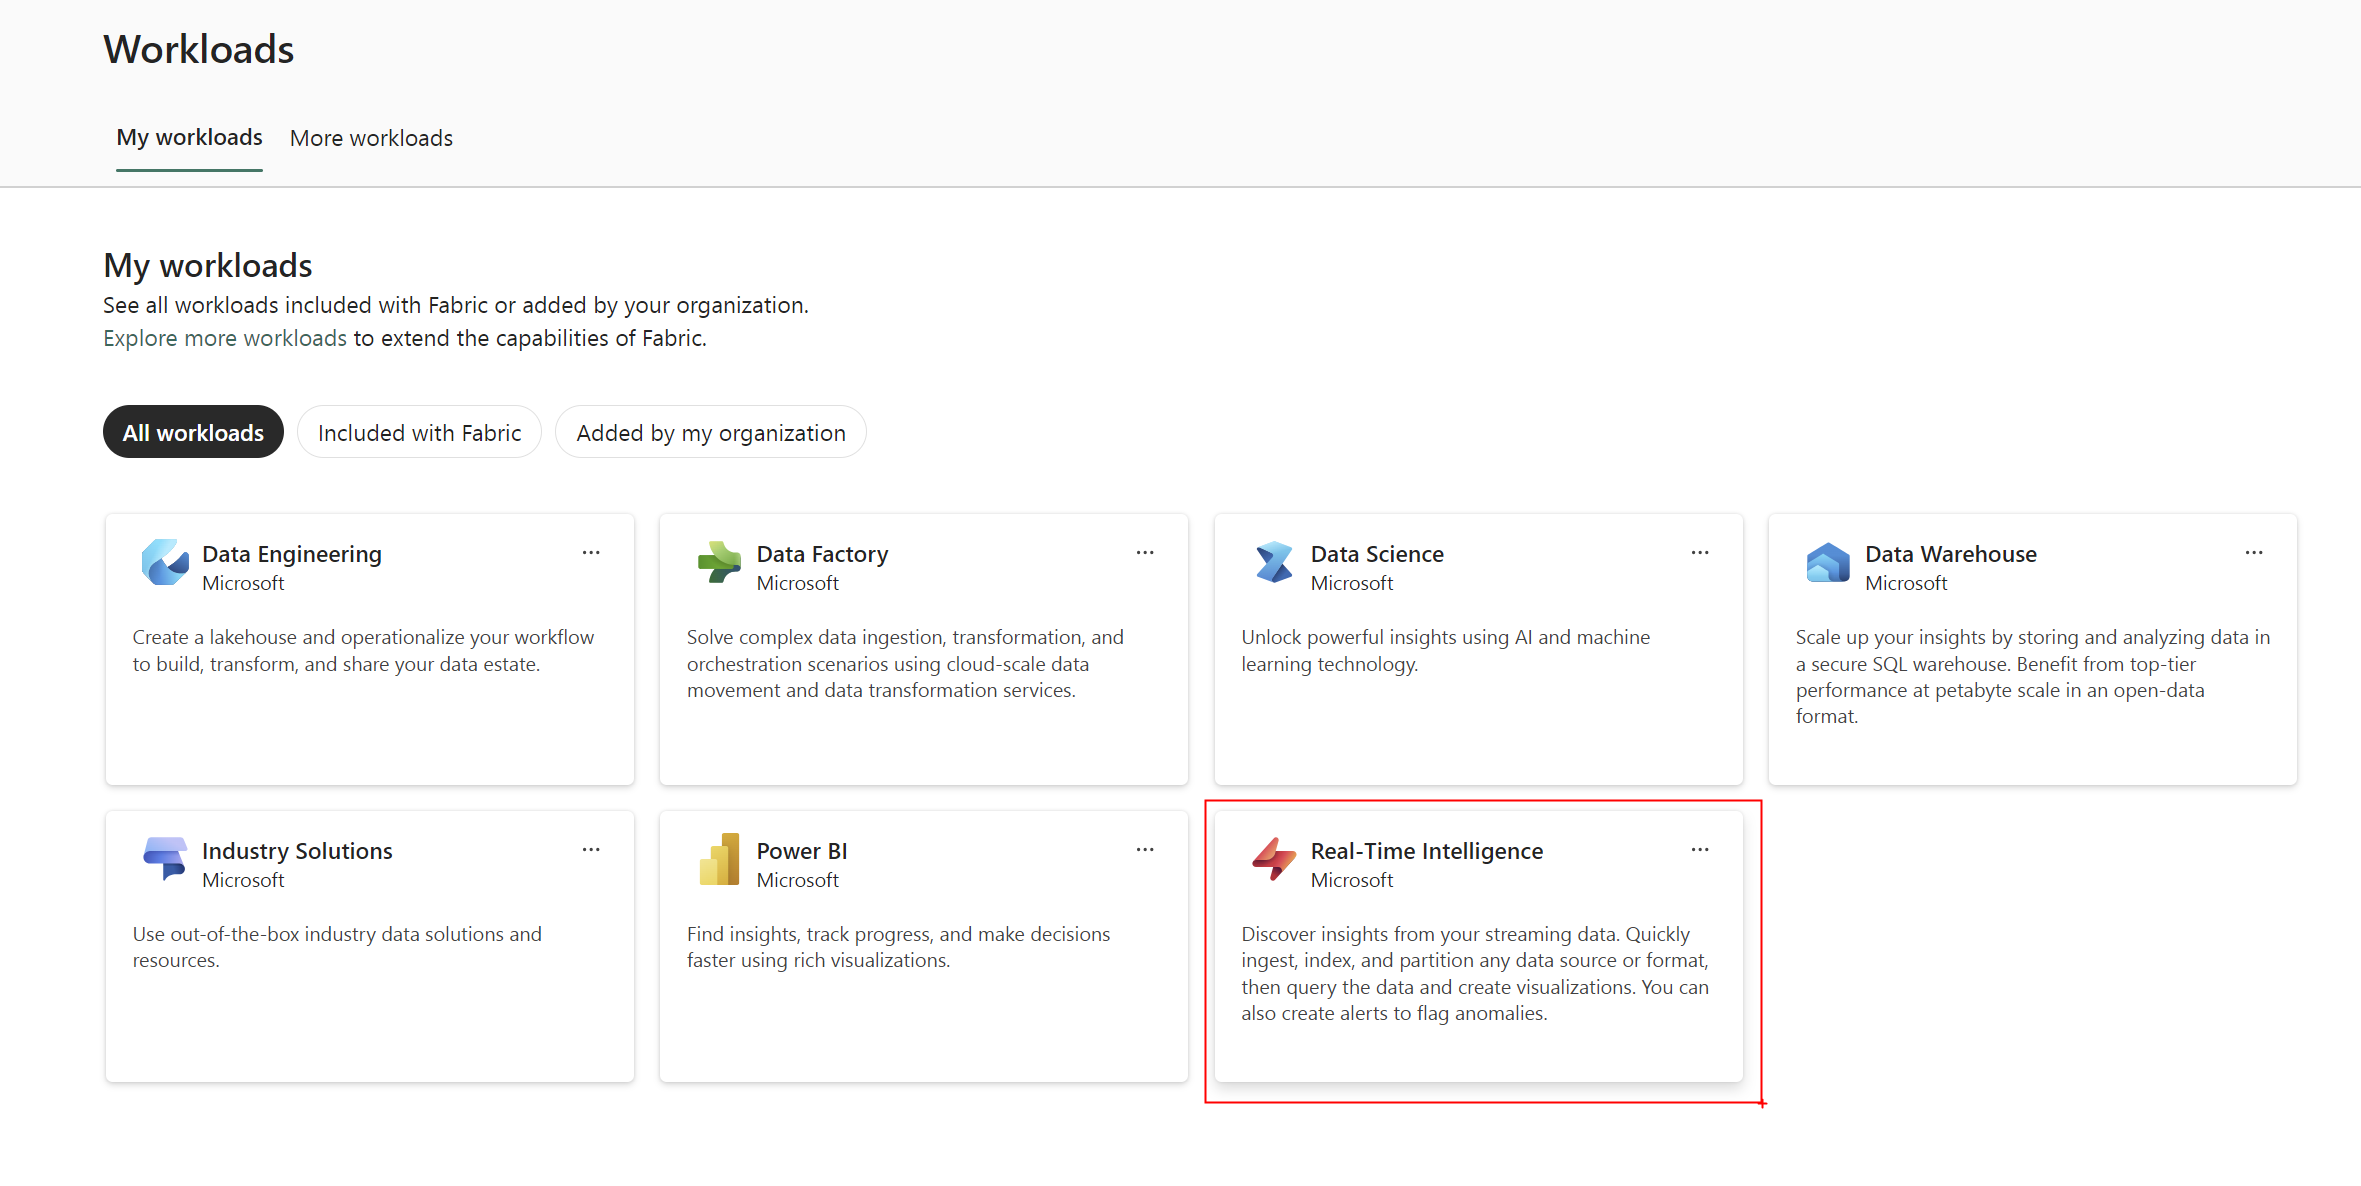
2. Fabric Workspace
- There is already Fabric workspace assigned to your user. Please use it during the workshop.
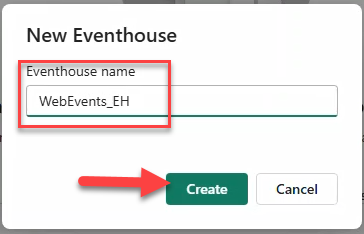
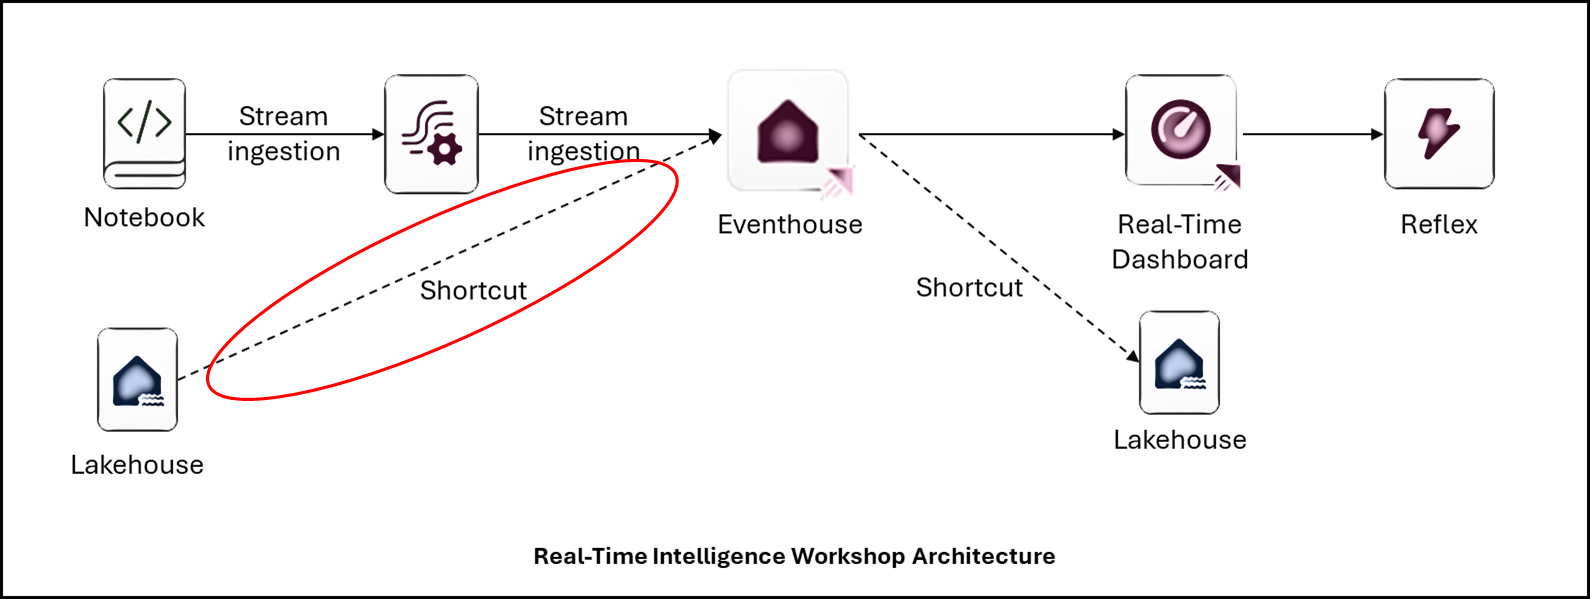
3. Create a new Eventhouse
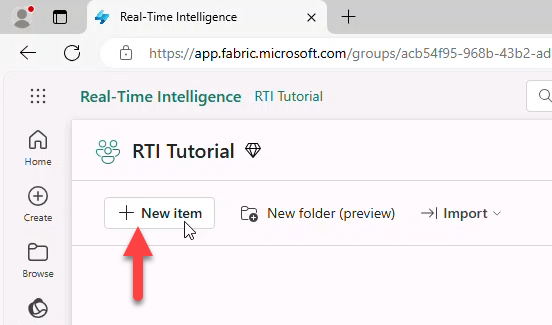
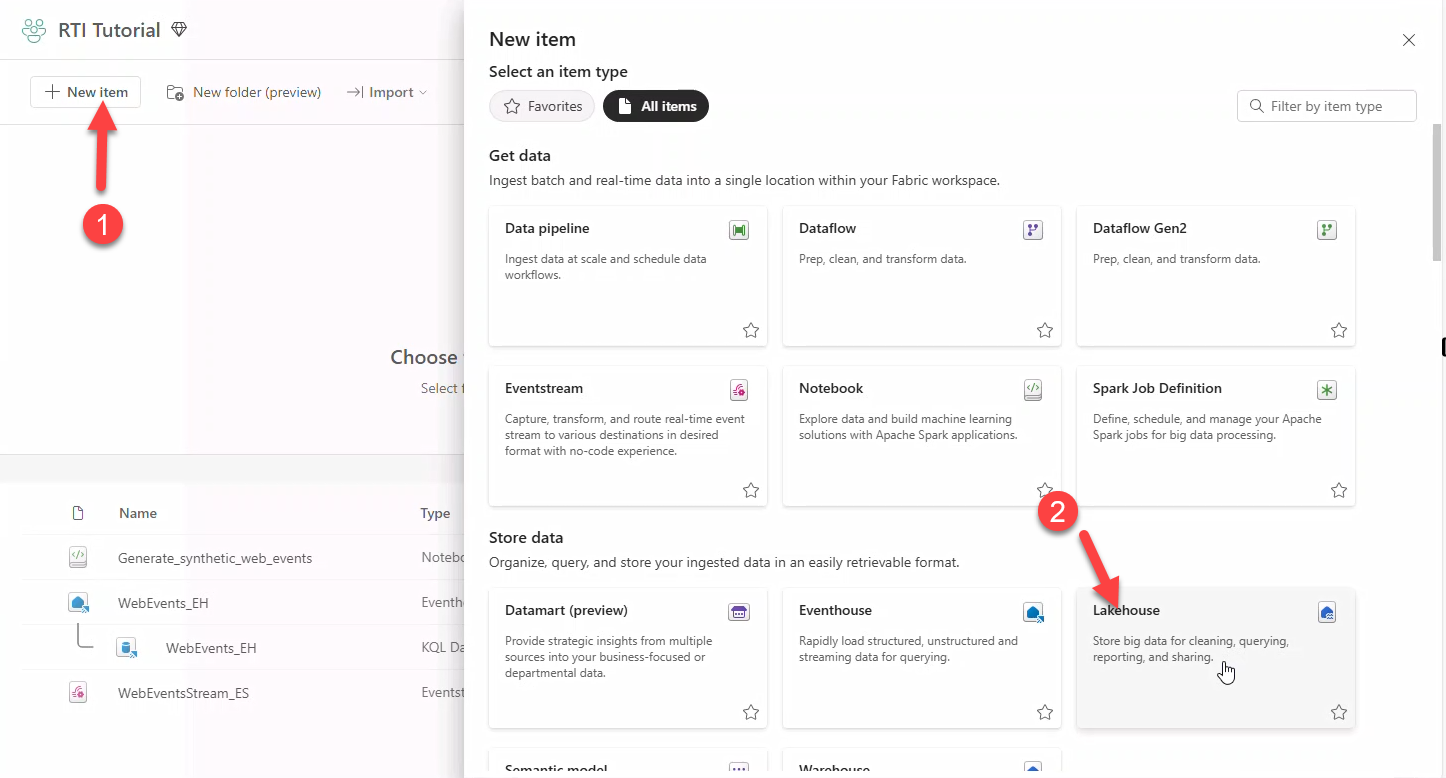
- Click + New Item.
- In New item select Eventhouse.
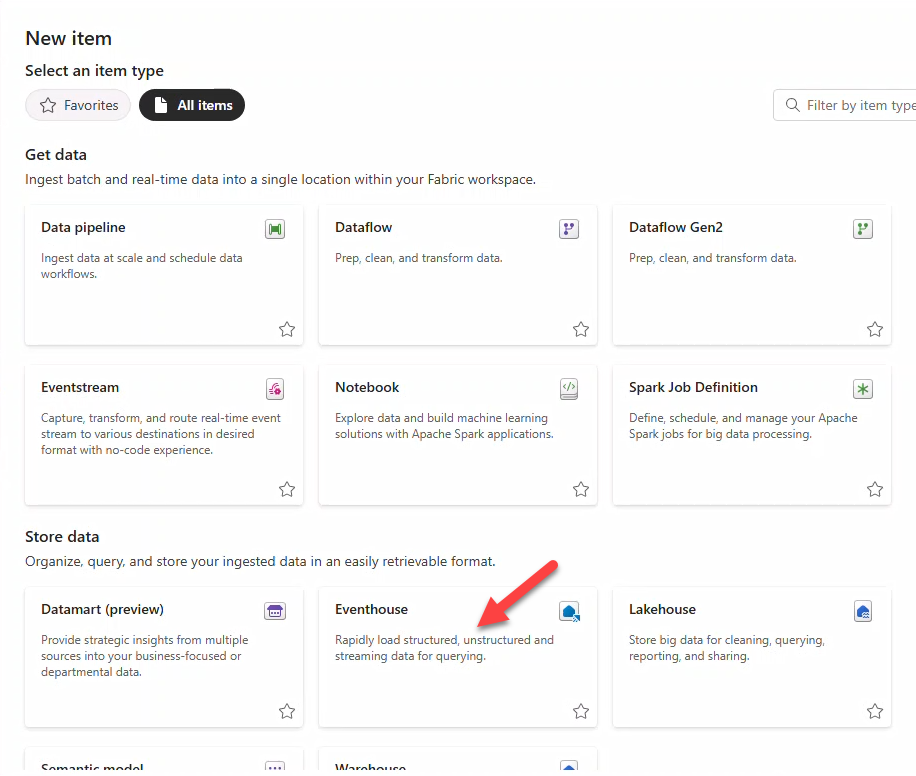
- In New Eventhouse insert
WebEvents_EHas name and click Create. After creation, it opens automatically.
Note
The Eventhouse is designed to handle real-time data streams efficiently, enabling timely insights. Data is indexed and partitioned by ingestion time.
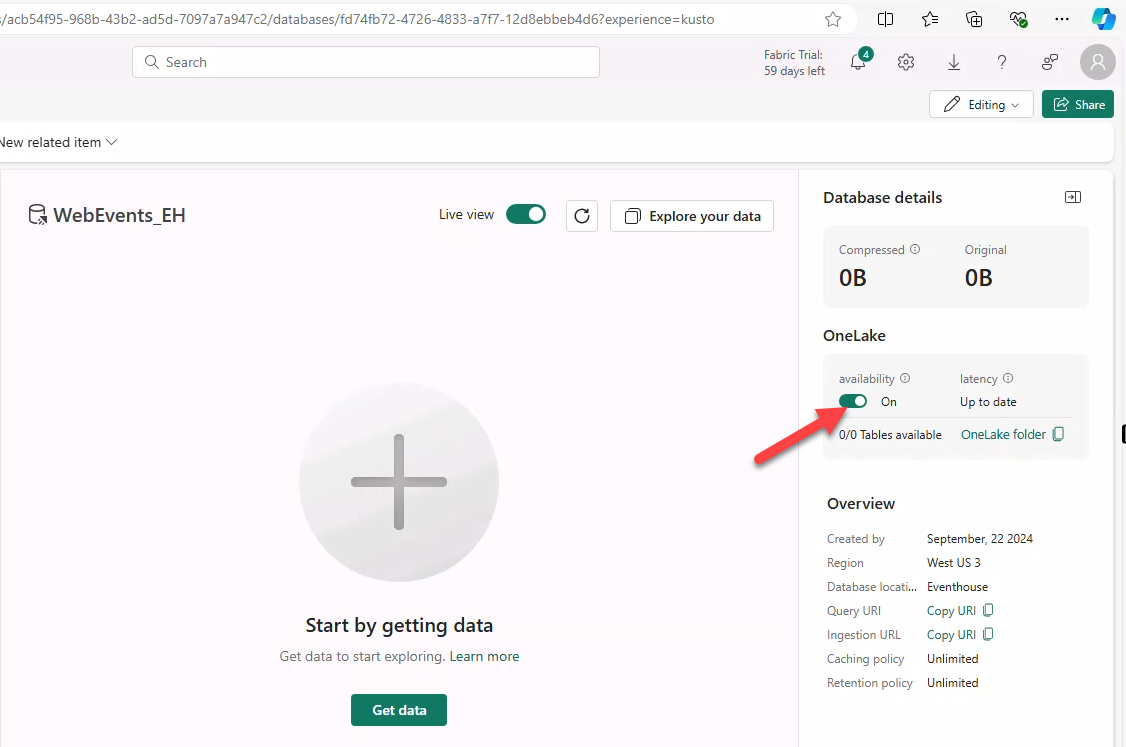
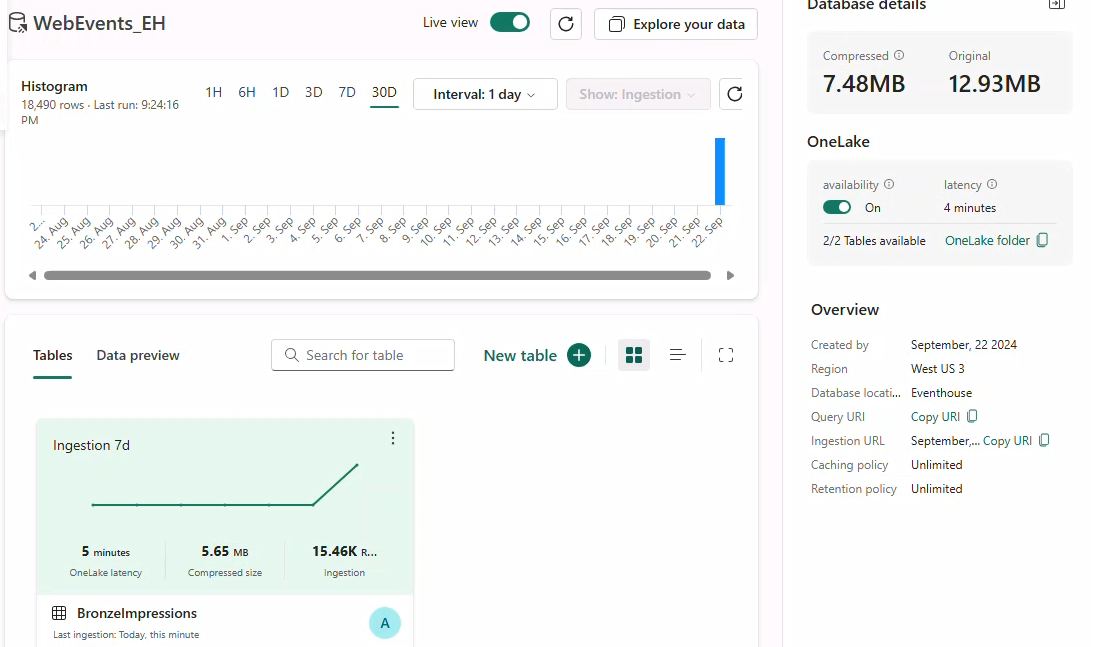
4. Enable OneLake Availability
Also called one logical copy. It lets KQL Database tables be accessed from a Lakehouse, Notebooks, etc in delta-parquet format via OneLake.
Setup
- Open the KQL Database WebEvents_EH under KQL Databases.
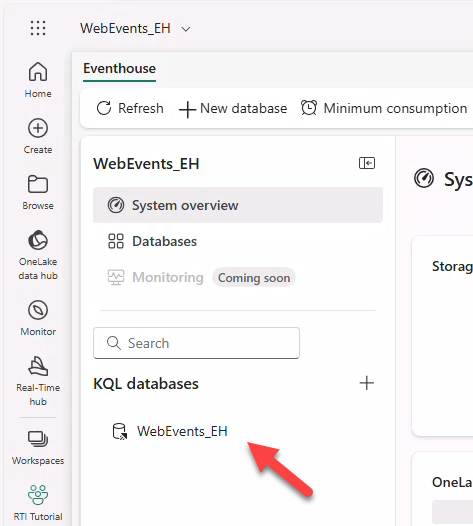
- Toggle availability to activate OneLake availability.
Note
Newly created tables inherit the Database-level OneLake availability setting.
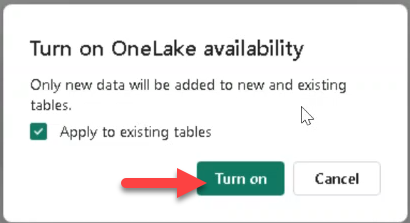
- Confirm Apply to existing tables and click Turn on.
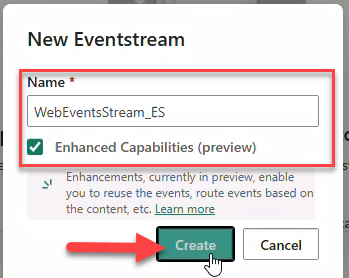
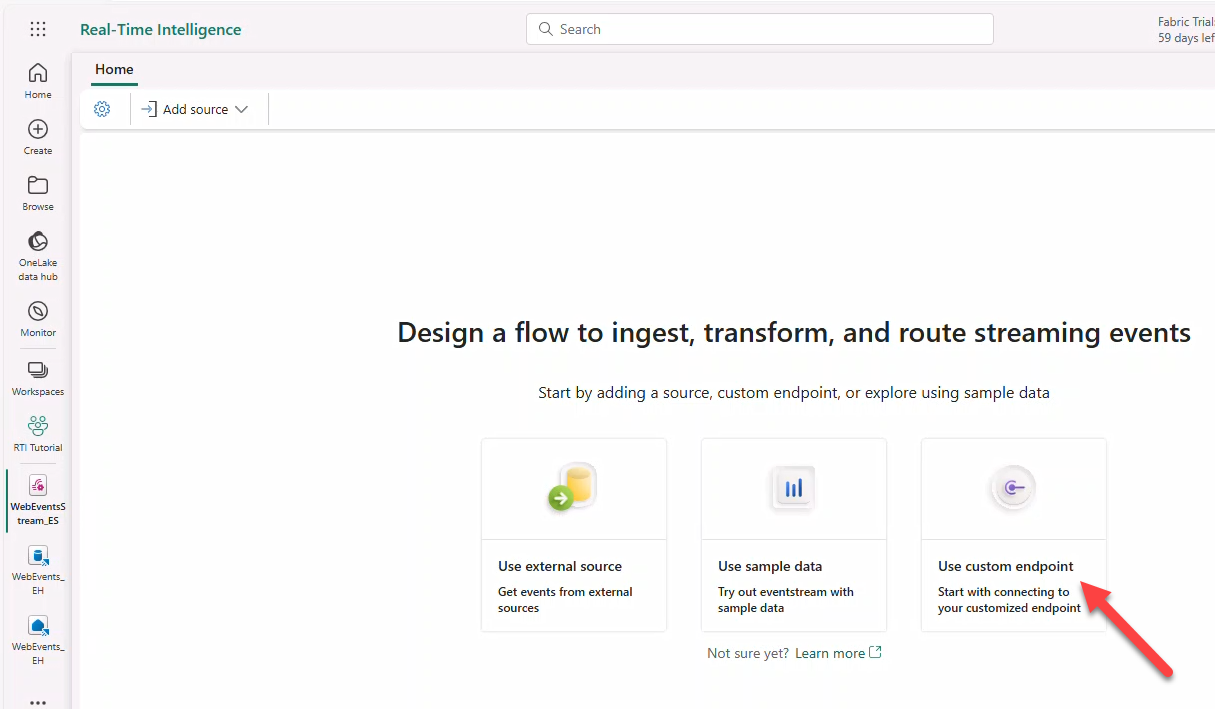
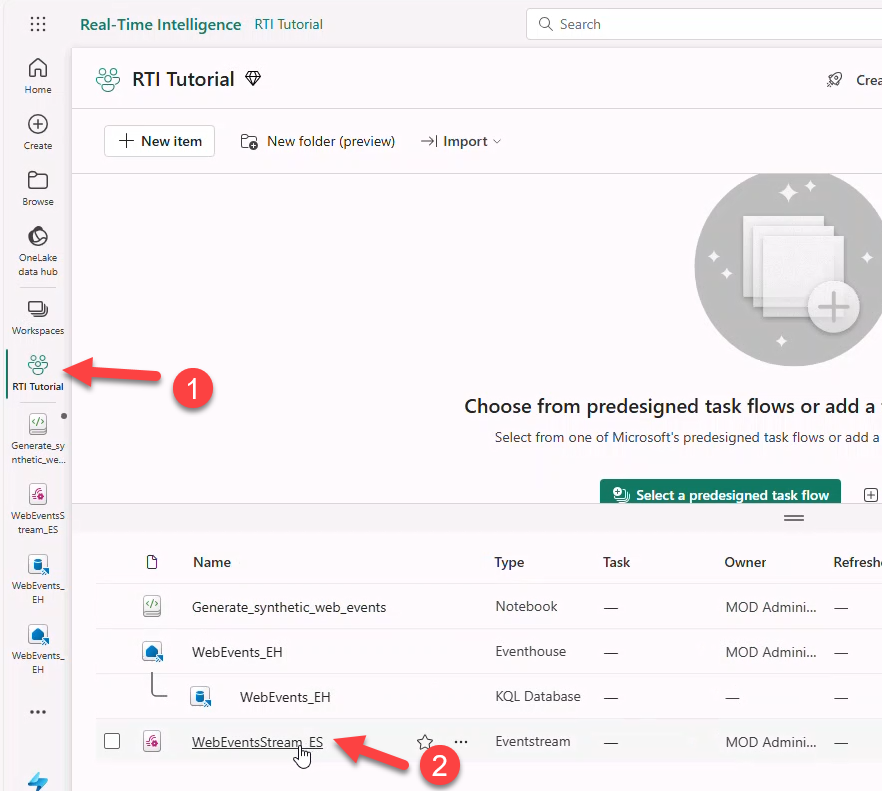
5. Create a new Eventstream
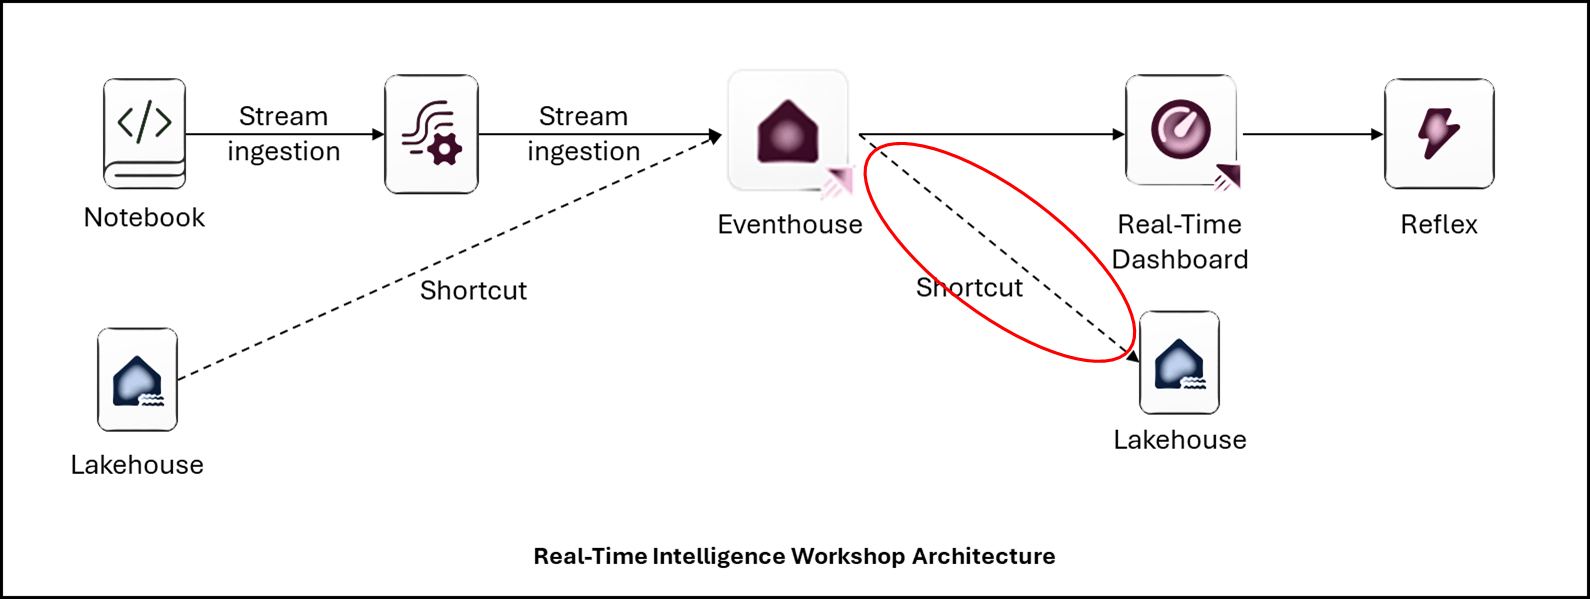
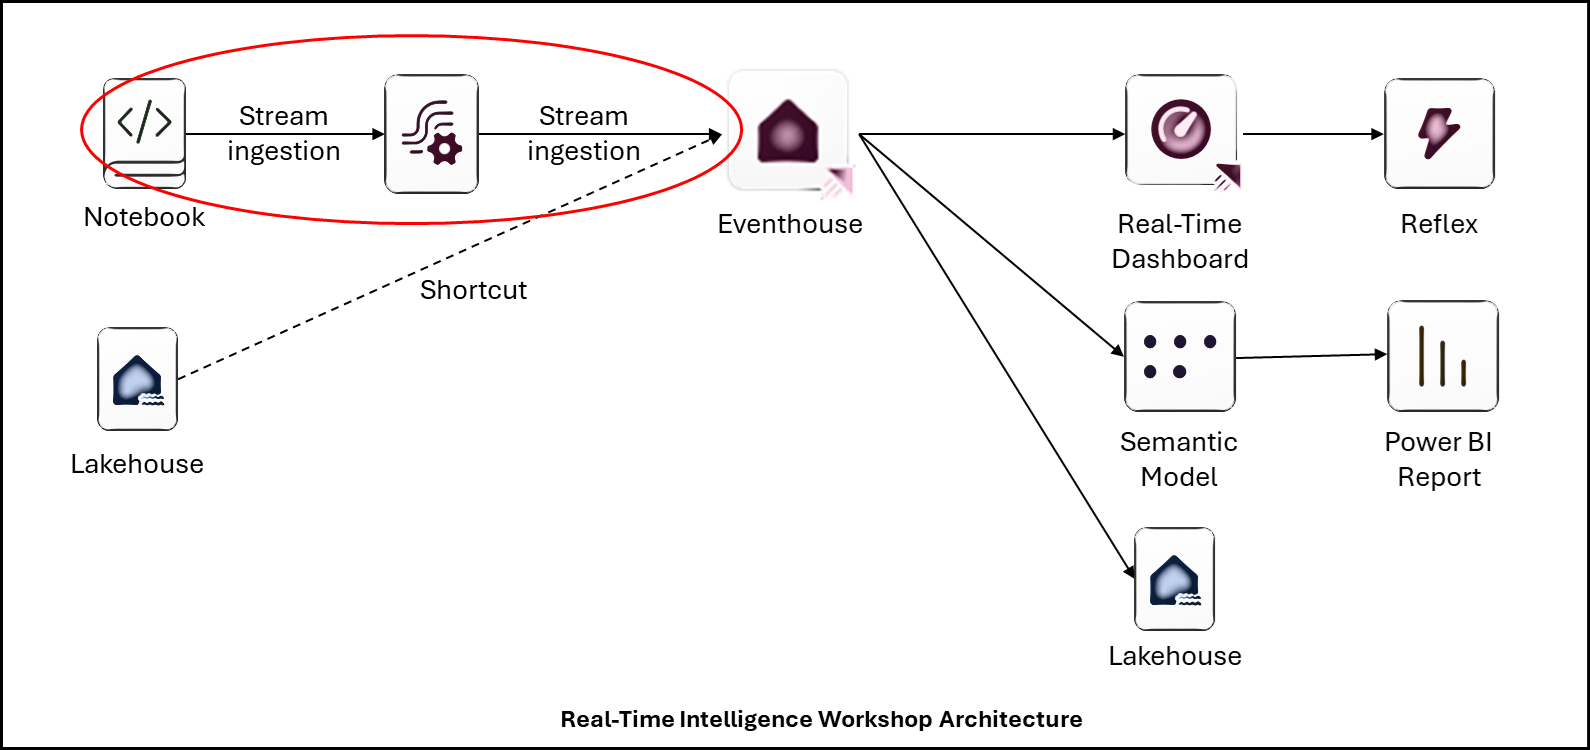
We will stream notebook-generated impressions and clicks into an Eventstream, consumed by the Eventhouse KQL Database.
- Open your Workspace (e.g., WorkSpace.Z.XXX) → + New Item → Eventstream.
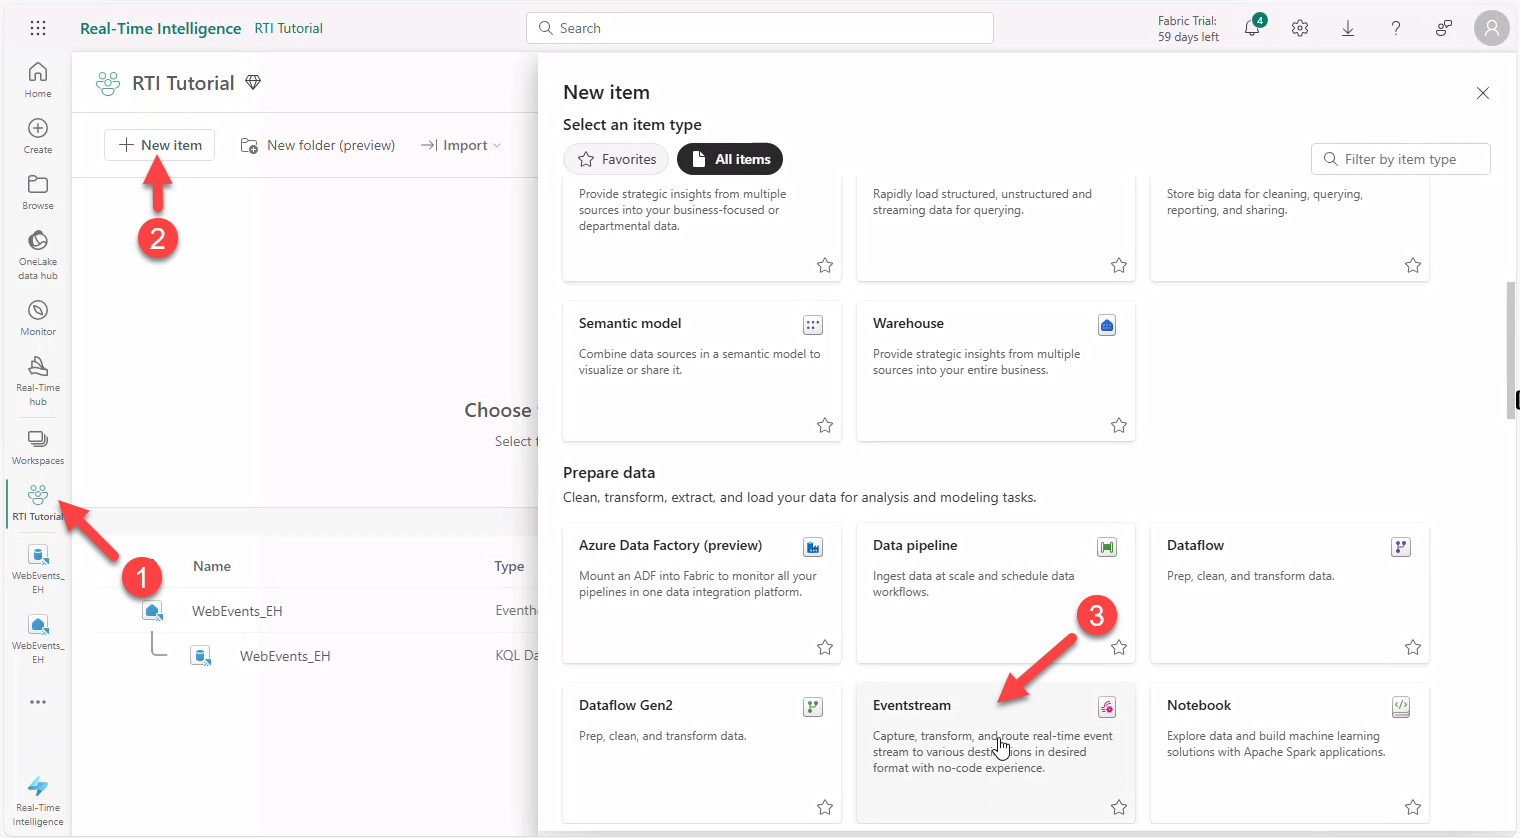
- Name it
WebEventsStream_ES, select Enhanced Capabilities, click Create.
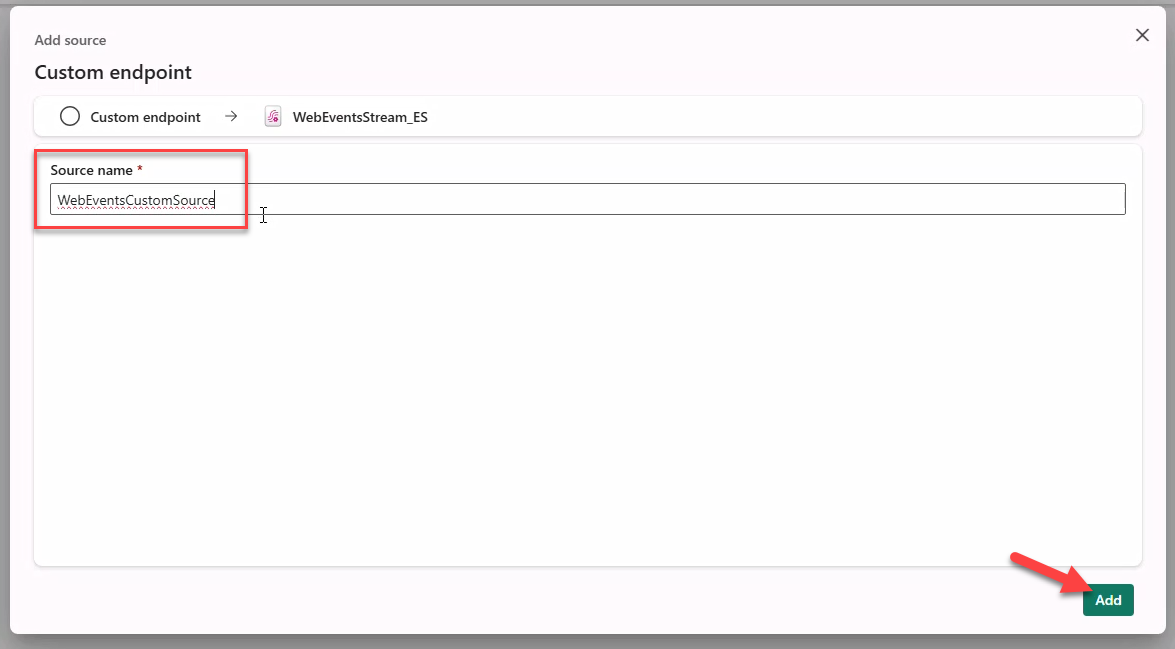
- On Design a flow... click Use Custom Endpoint to create an Event Hub.
- Source name:
WebEventsCustomSource→ Add.
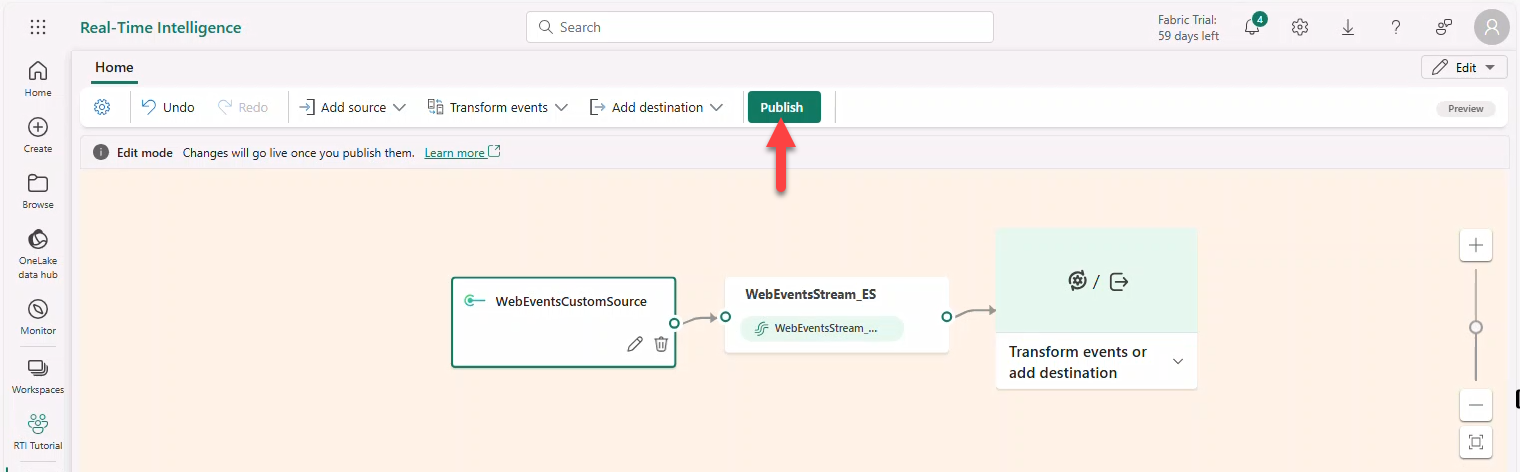
- Click Publish to create the Event Hub.
- Select source WebEventsCustomSource → Keys → copy Event hub name.
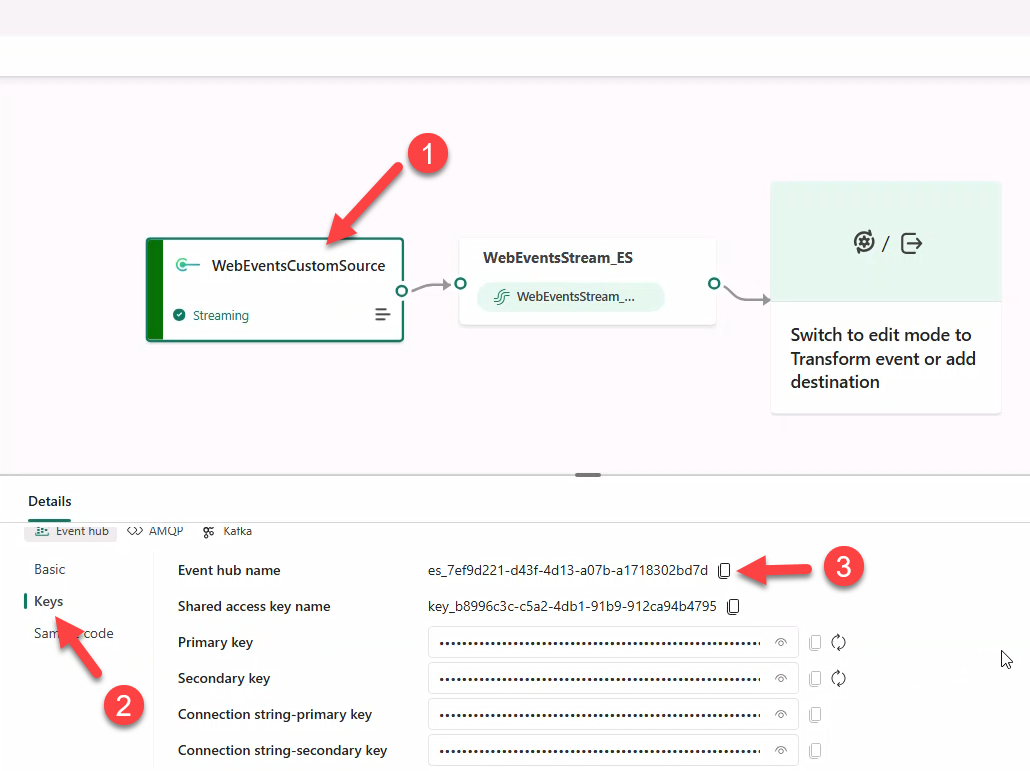
Note
Copy values into Notepad for later reference.
- Reveal and copy the connection string (primary or secondary).
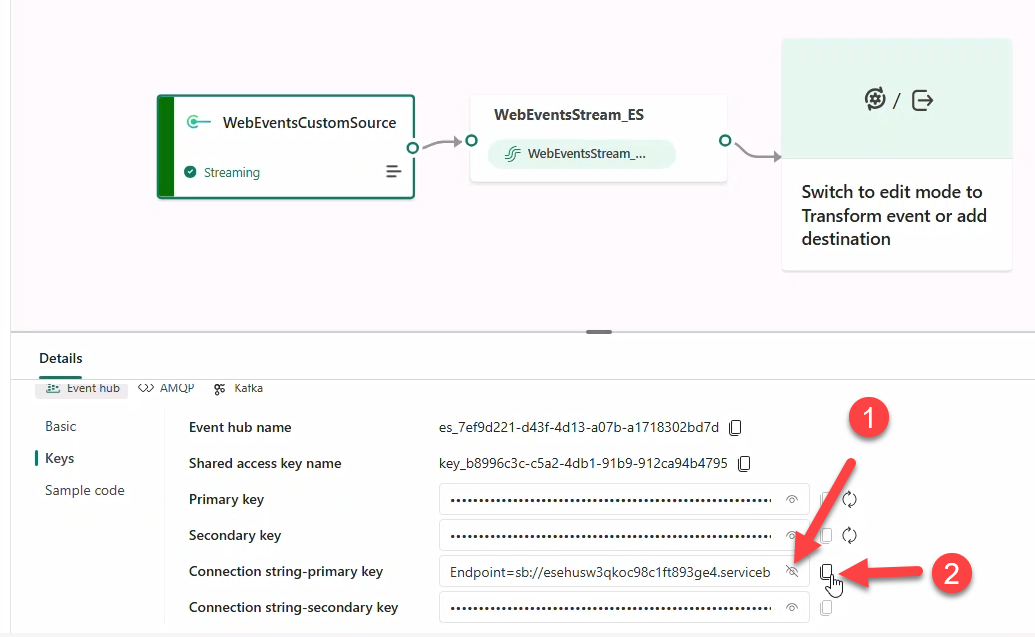
Note
Connection string must be visible to copy. Kafka endpoints are also provided.
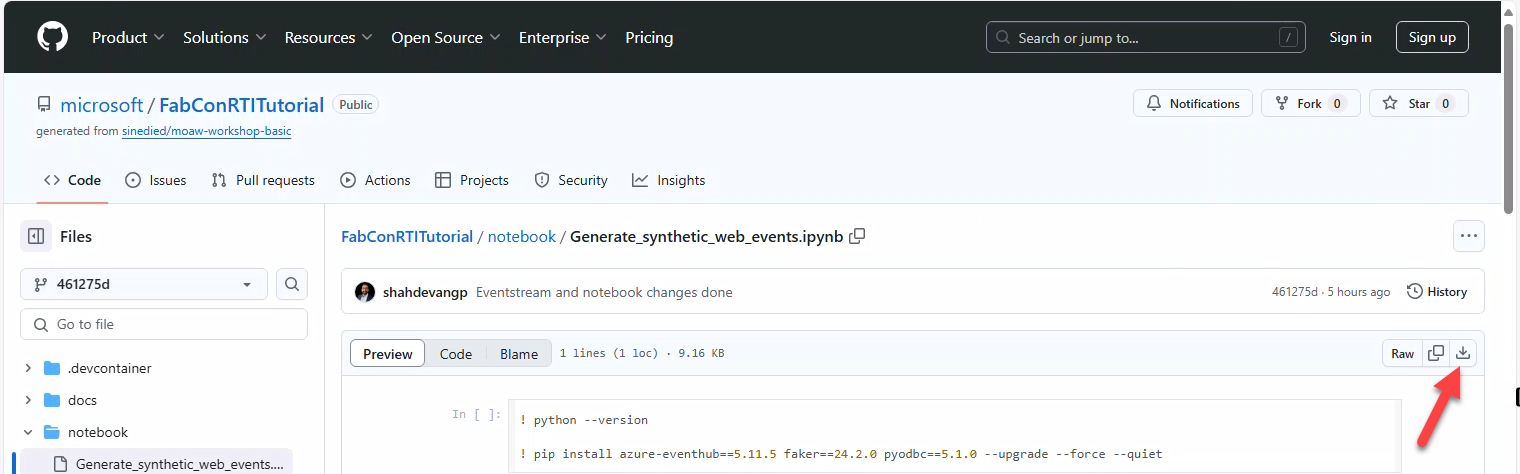
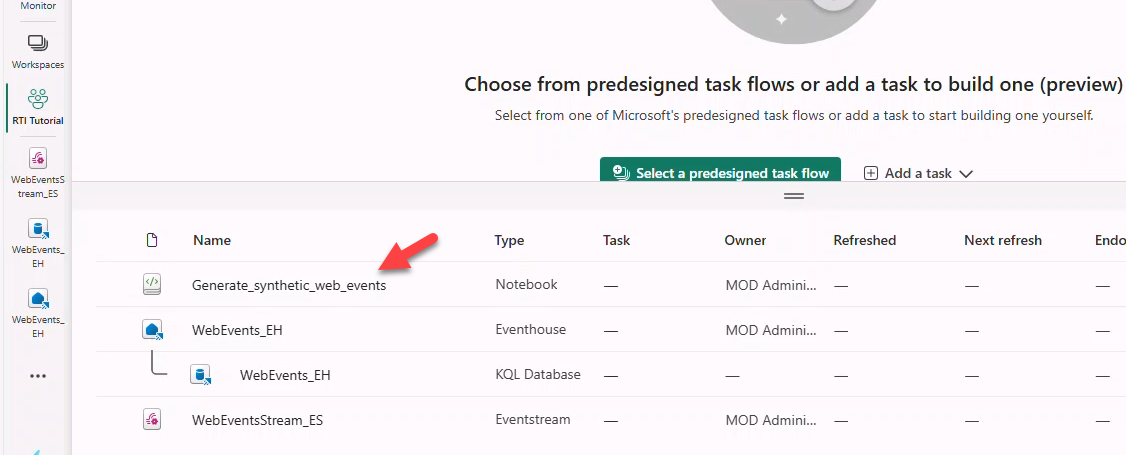
6. Import Data Generator Notebook
Use the Python notebook Generate_synthetic_web_events.ipynb.
- Open the notebook in GitHub → Download raw file.
Import it to your Fabric Workspace:
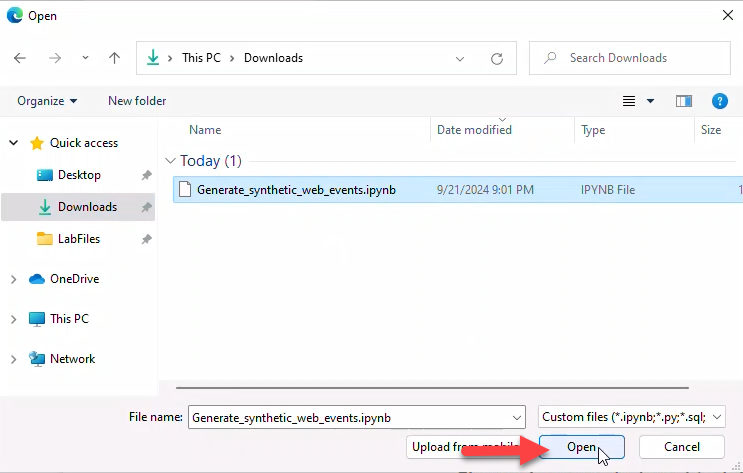
- Go to workspace (e.g., RTI Tutorial) → Import → Notebook → From this computer.
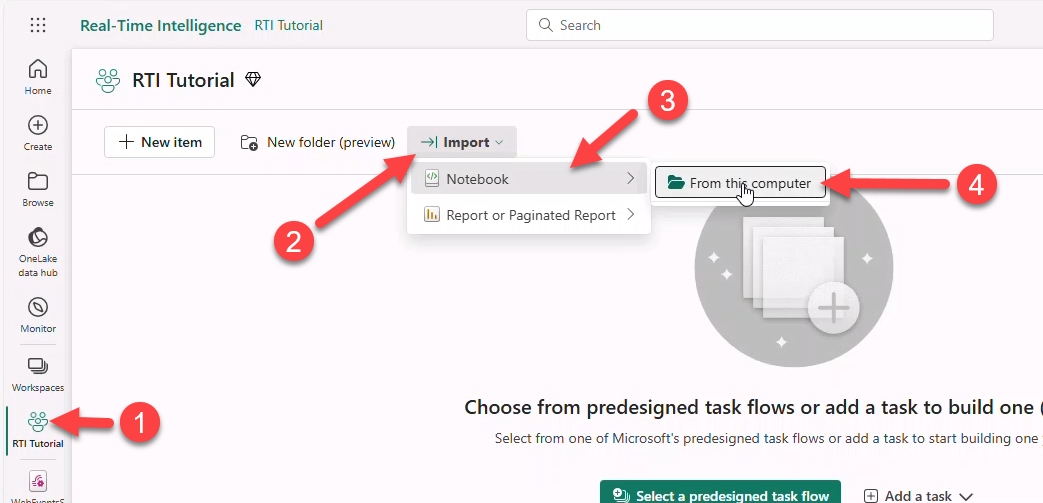
- In Import status select Upload.
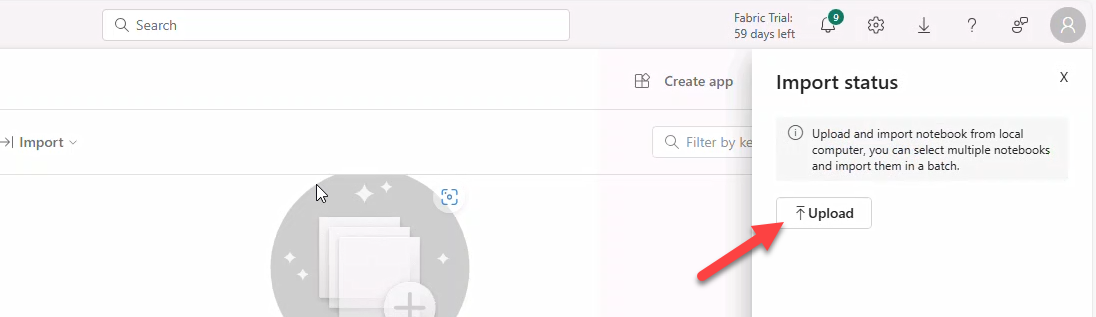
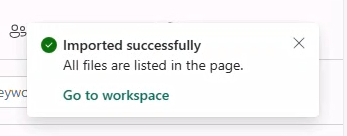
- Browse and open the downloaded notebook. Fabric will confirm successful import.
7. Run the notebook
Note
DO NOT use an InPrivate browser window. Use a Personal window.
- Open Generate_synthetic_web_events in your workspace.
- Paste
eventHubNameeventsandeventHubConnStringfrom Task 5.
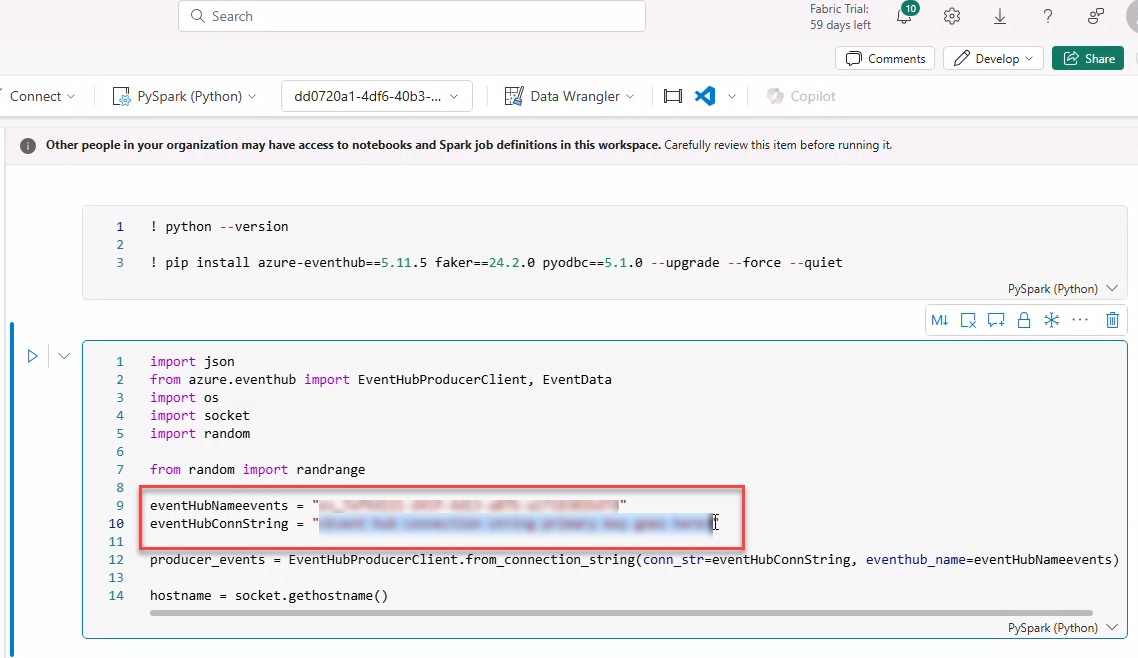
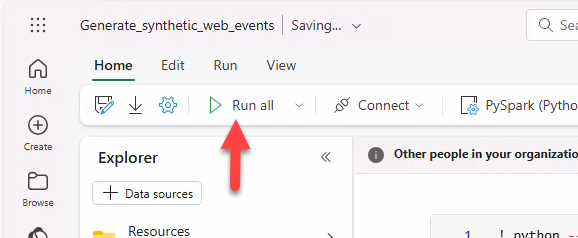
- Click Run all.
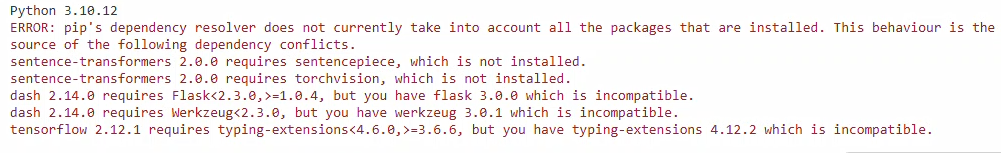
Note
Errors in cell 1 due to already installed libraries can be ignored.
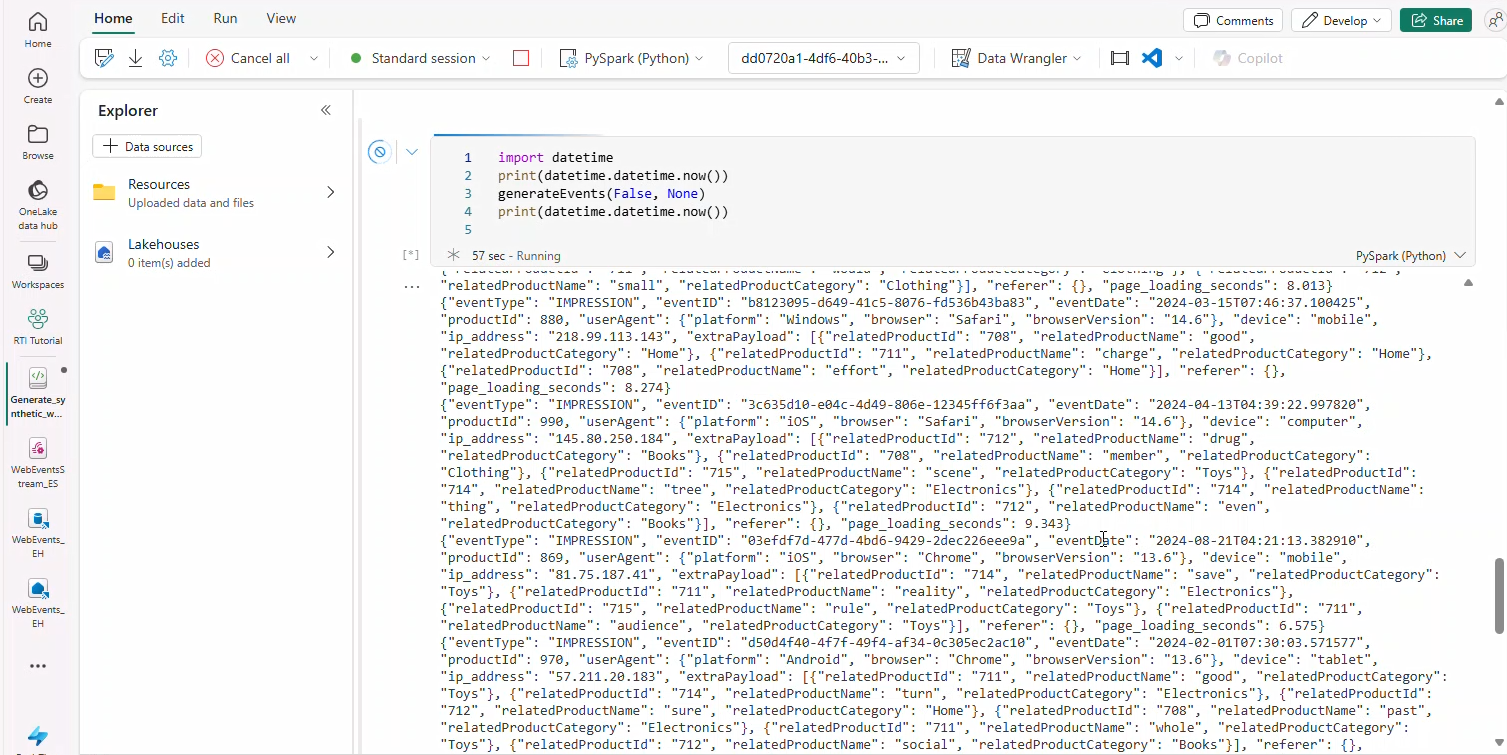
- Scroll to last code cell; confirm JSON events output appears.
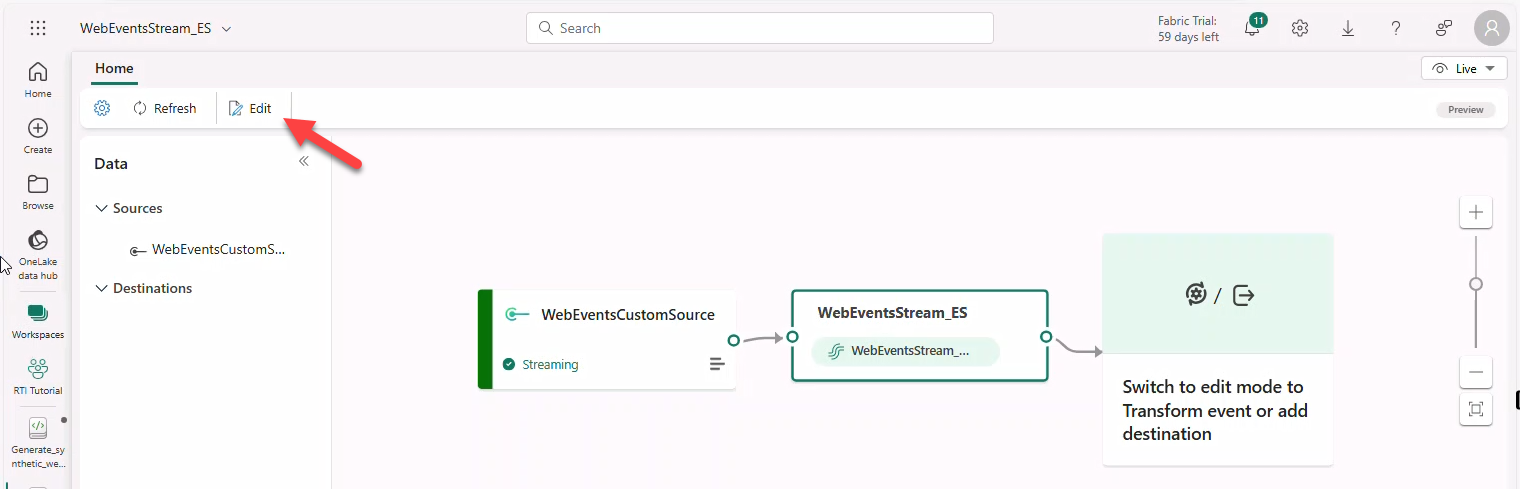
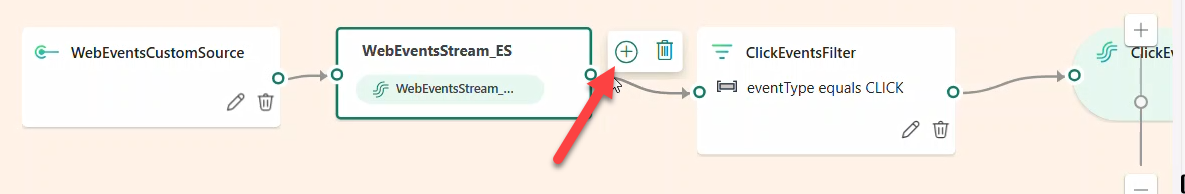
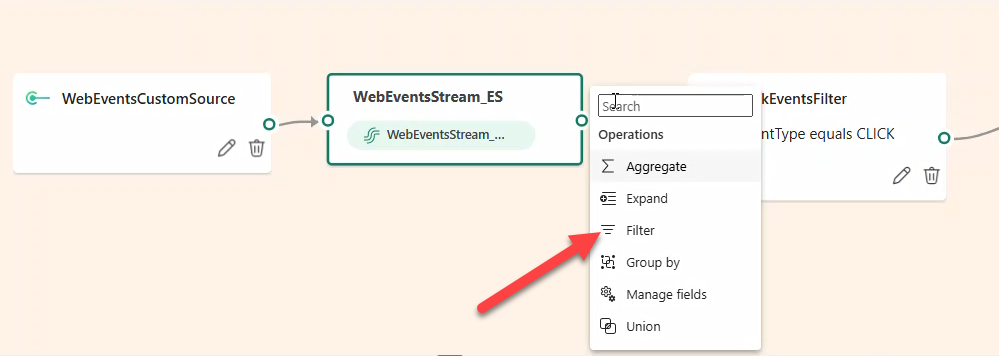
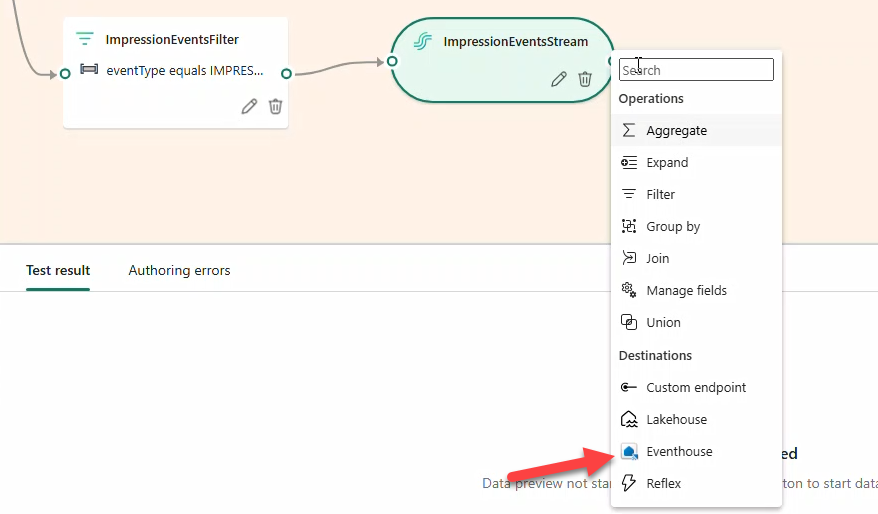
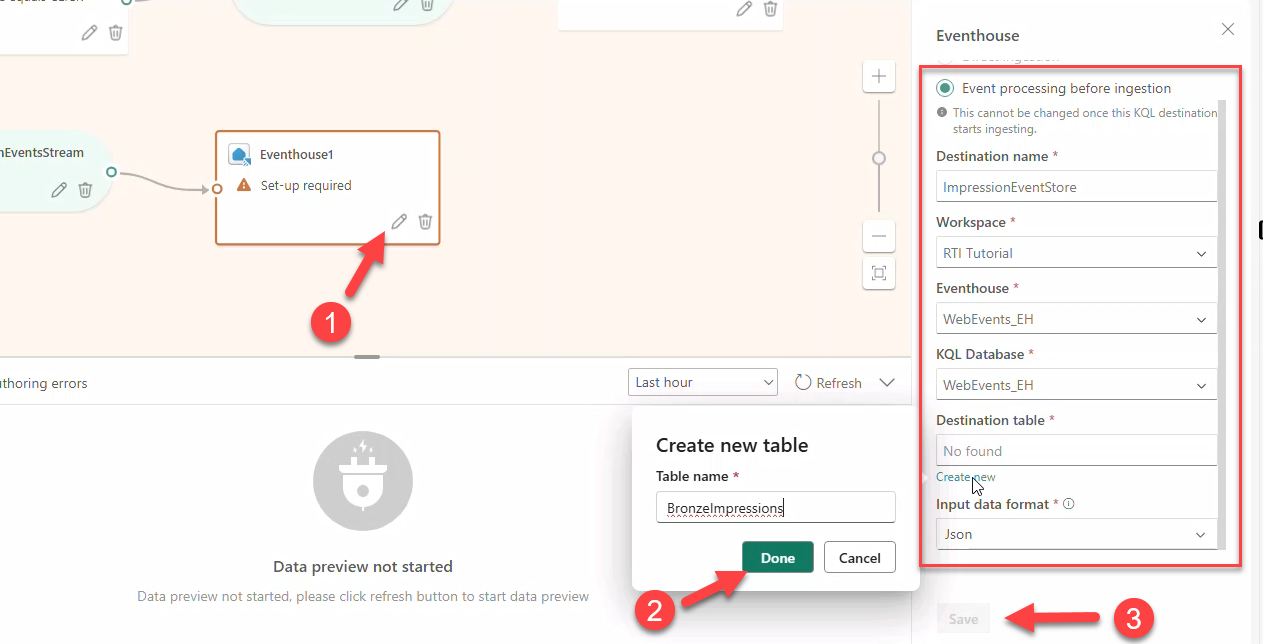
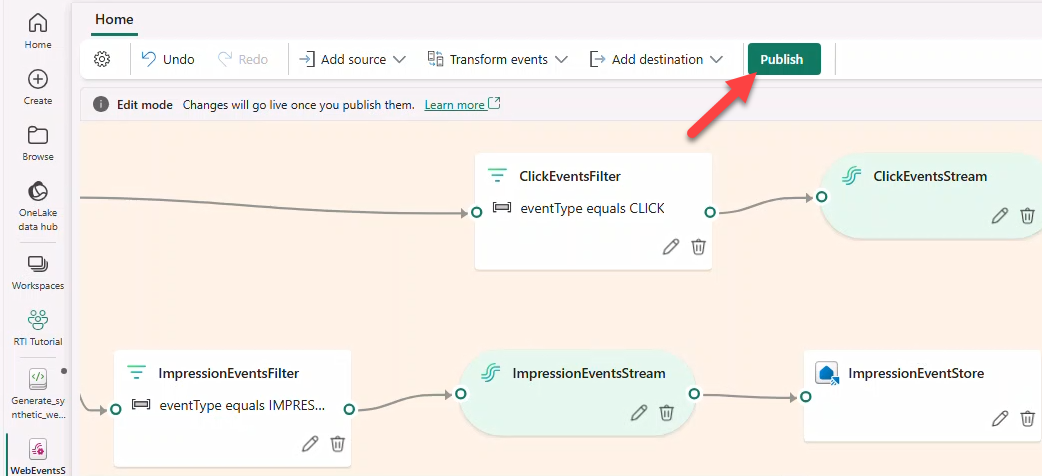
8. Define Eventstream topology
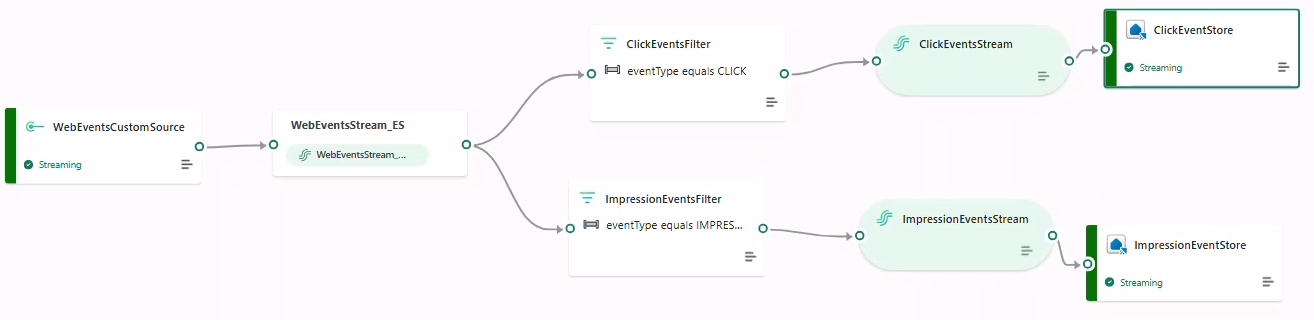
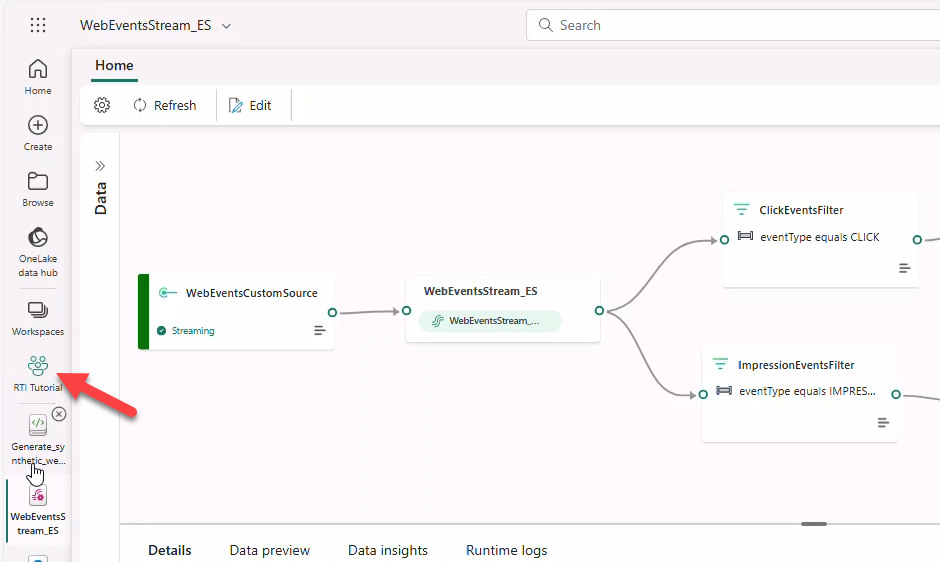
- Open Eventstream WebEventStream_ES → Edit.
- Add Filter → name
ClickEventsFilterto keepeventType == CLICK.
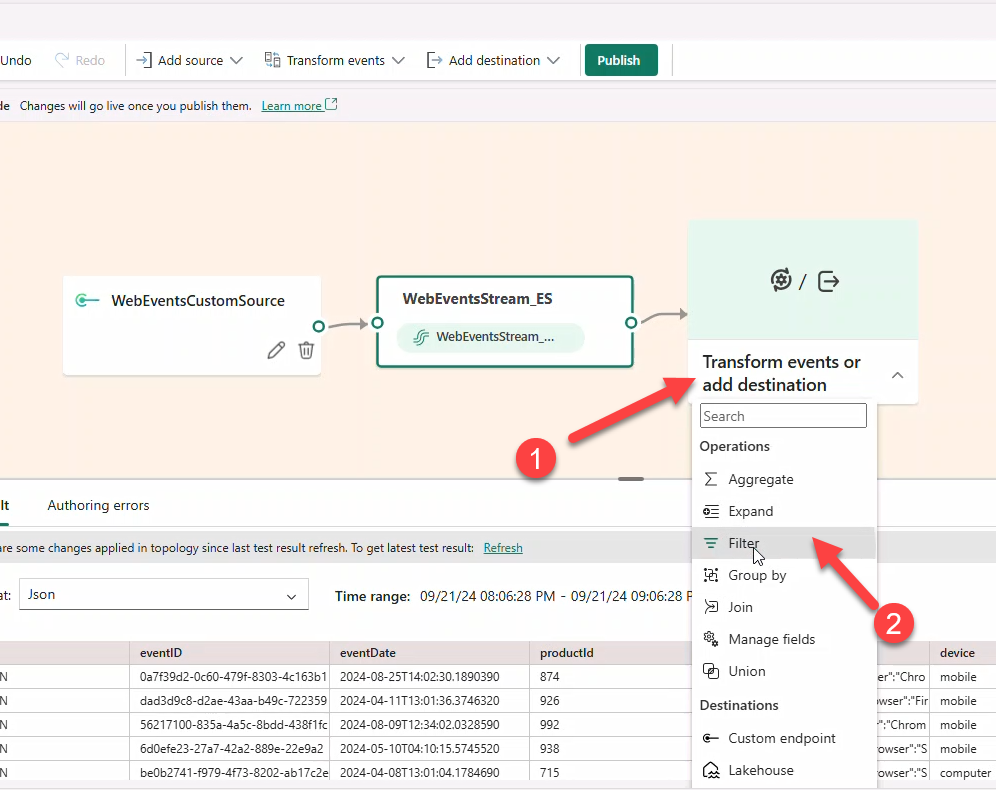
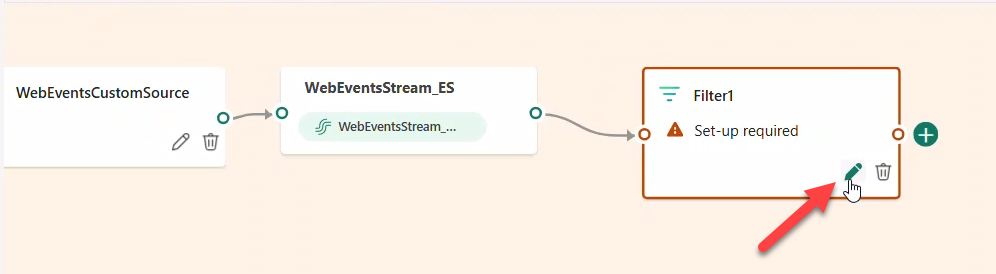
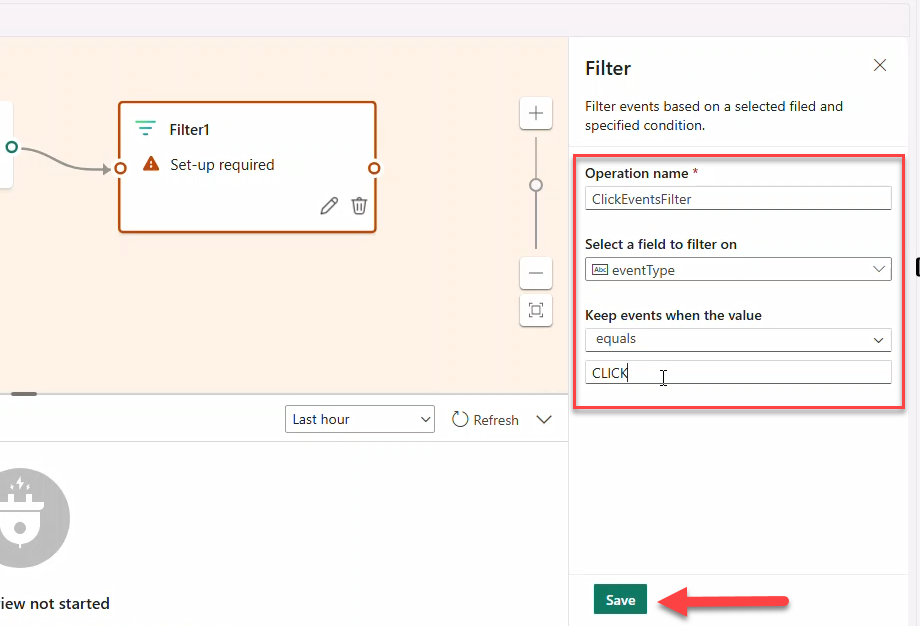
Note
CLICK is in ALL CAPS. The filter may show an error until a destination is added.
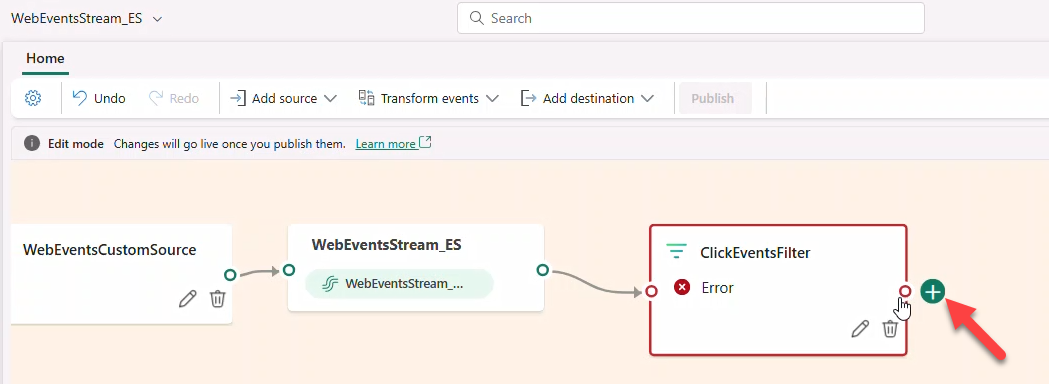
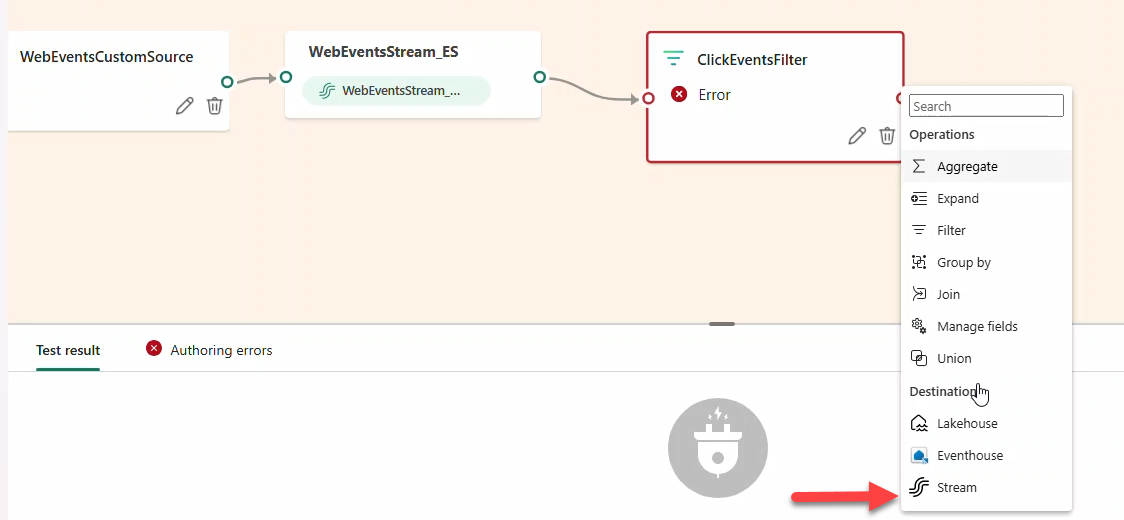
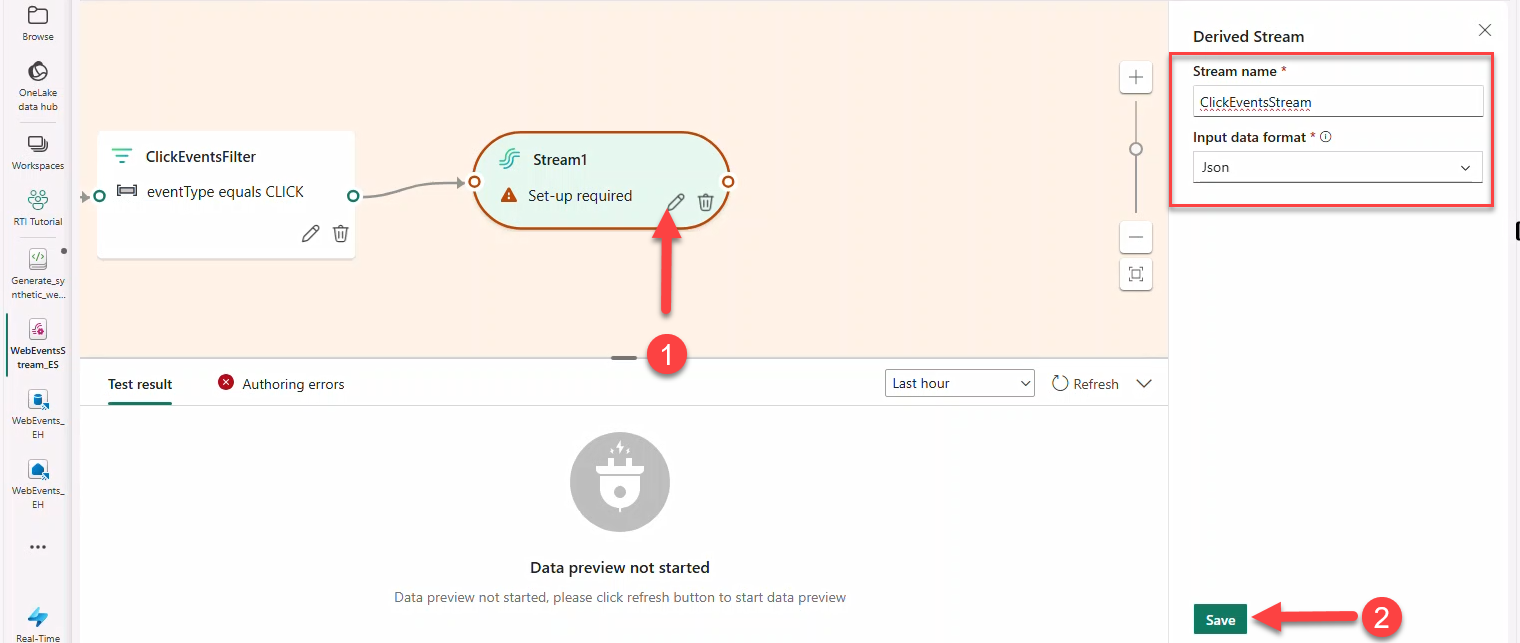
- Connect a Stream named
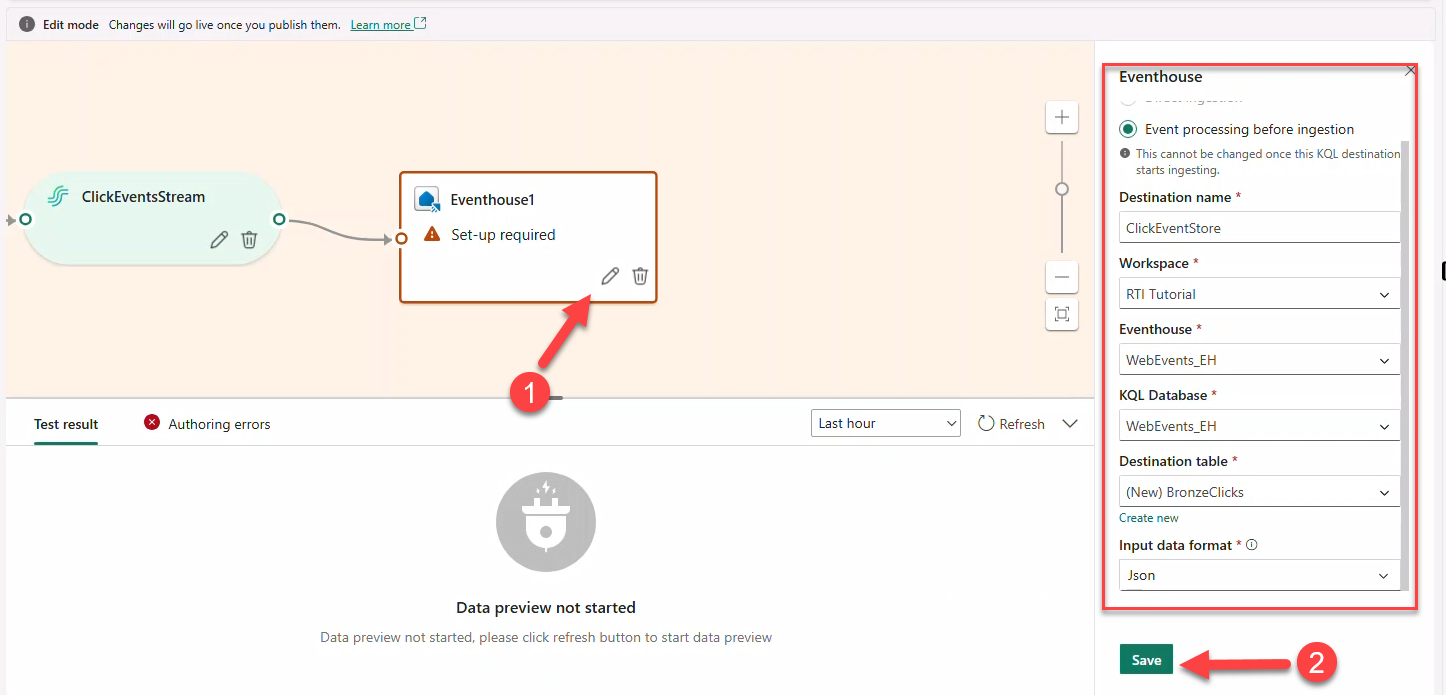
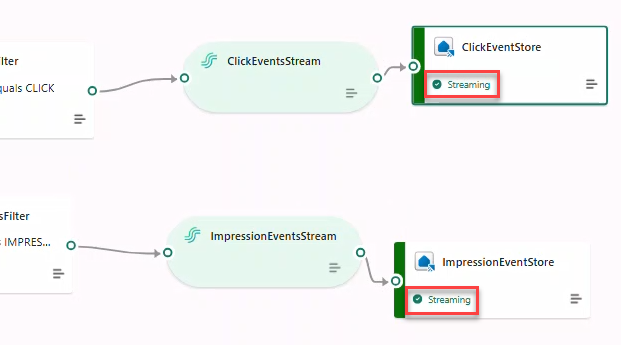
ClickEventsStream(JSON) → destination Eventhouse → create tableBronzeClicks.
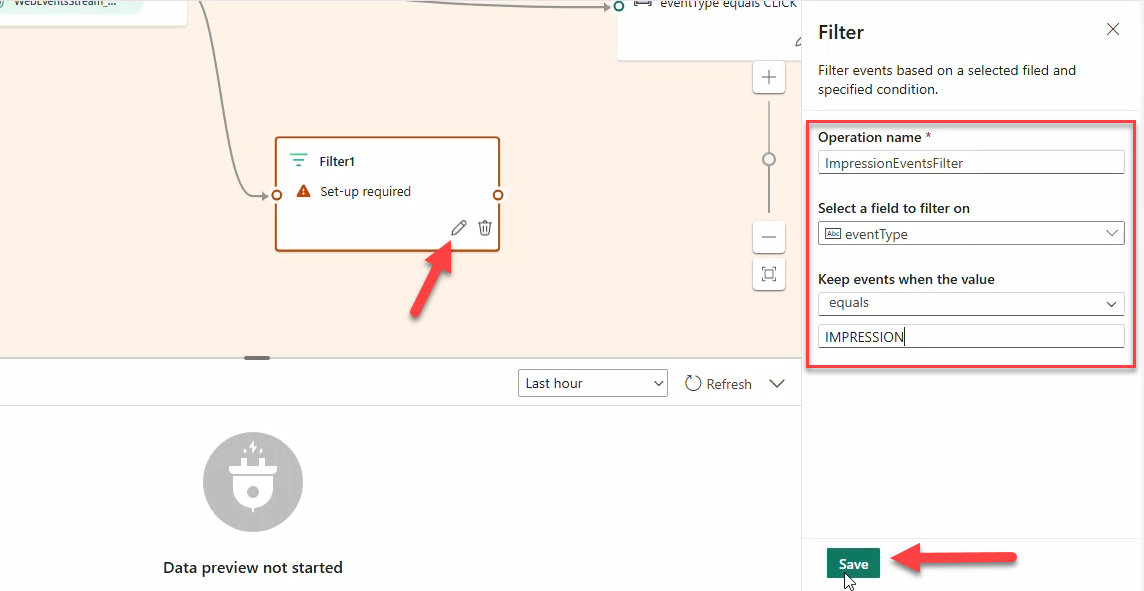
- Add a second Filter
ImpressionEventsFilterforeventType == IMPRESSION→ StreamImpressionsEventsStream(JSON) → Eventhouse tableBronzeImpressions.
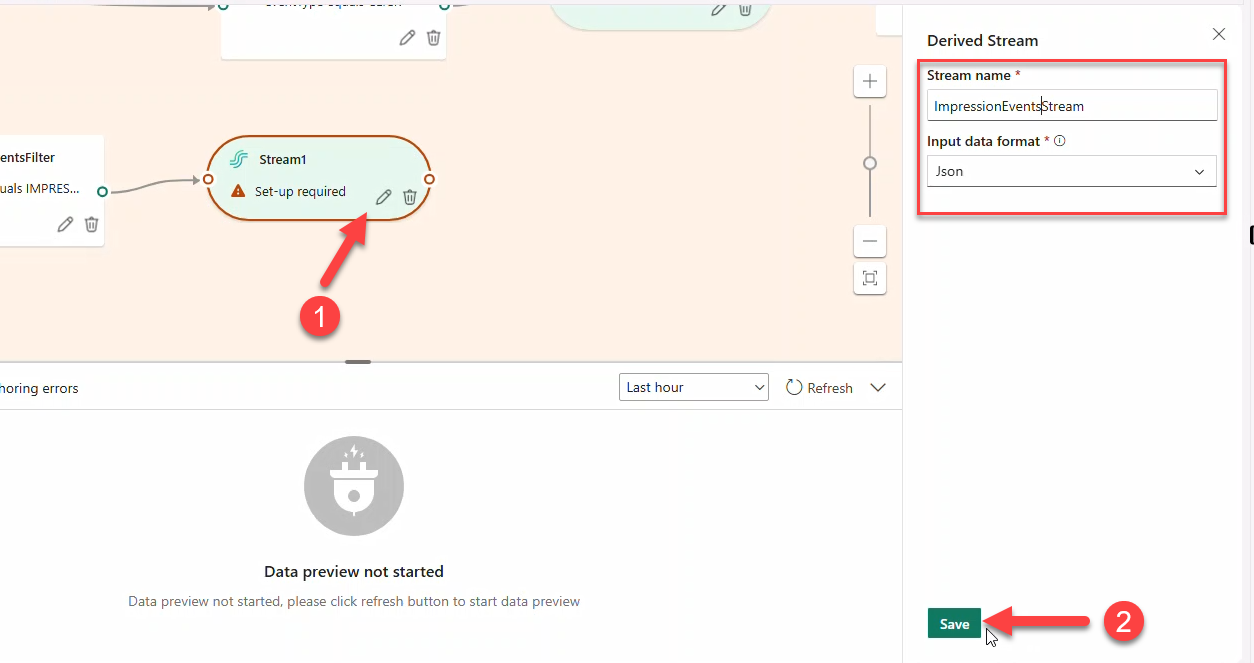
- Click Publish. After a few minutes, destinations switch to Streaming.
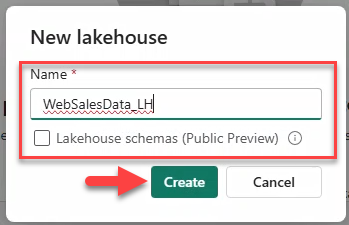
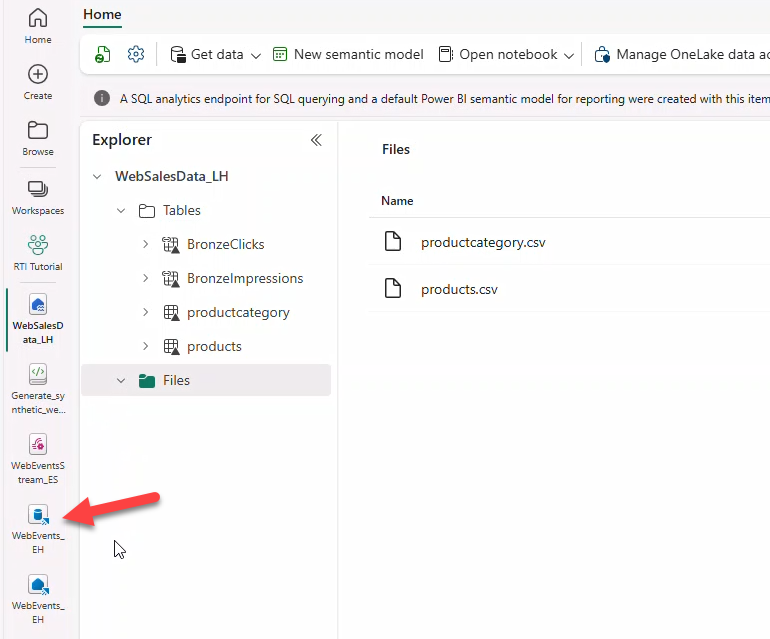
9. Setting up the Lakehouse
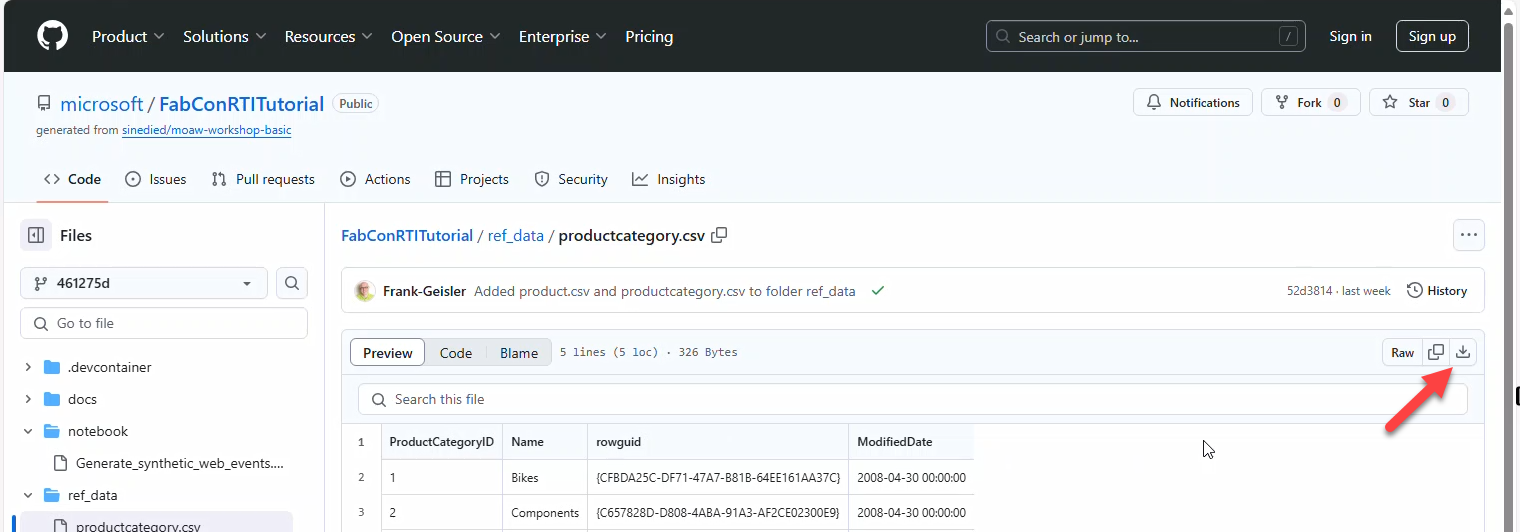
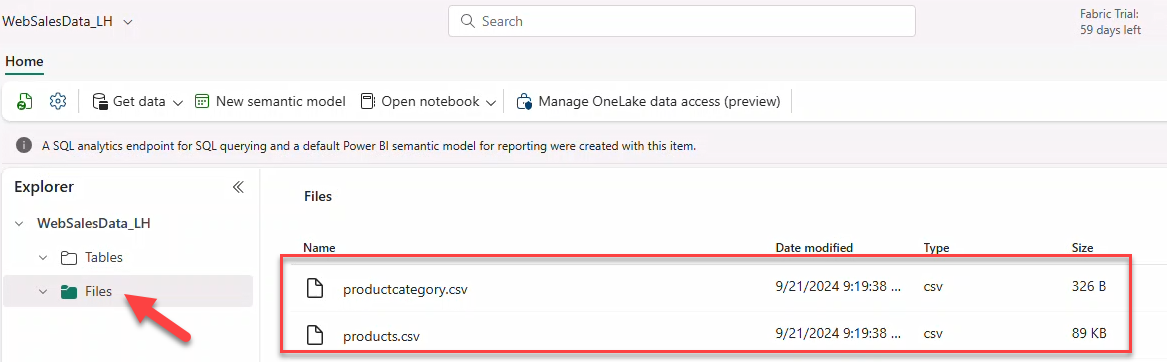
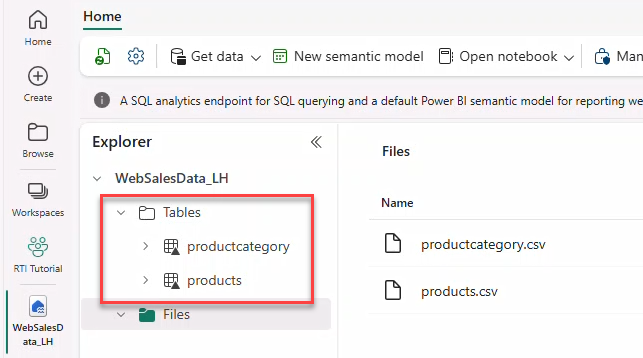
Download products.csv and productcategory.csv from the repo and create a Lakehouse WebSalesData_LH (schemas disabled).
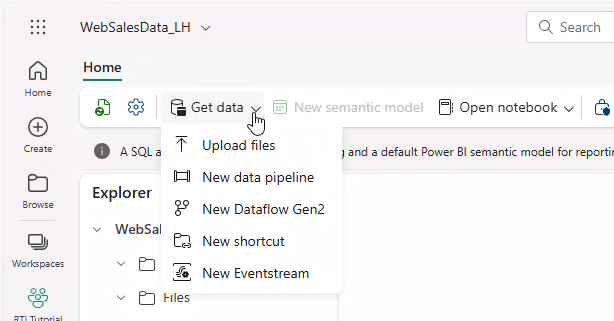
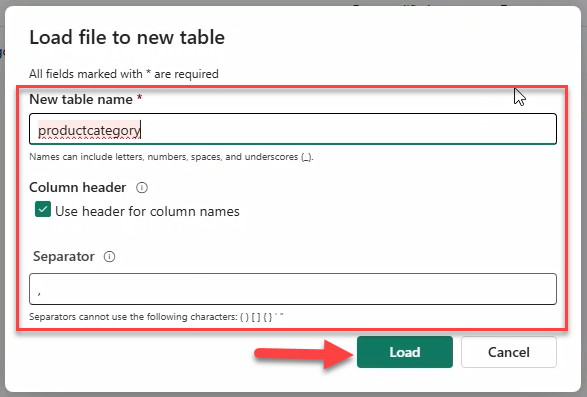
10. Uploading reference data files and creating delta tables
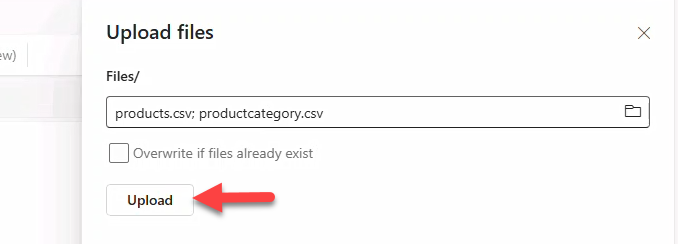
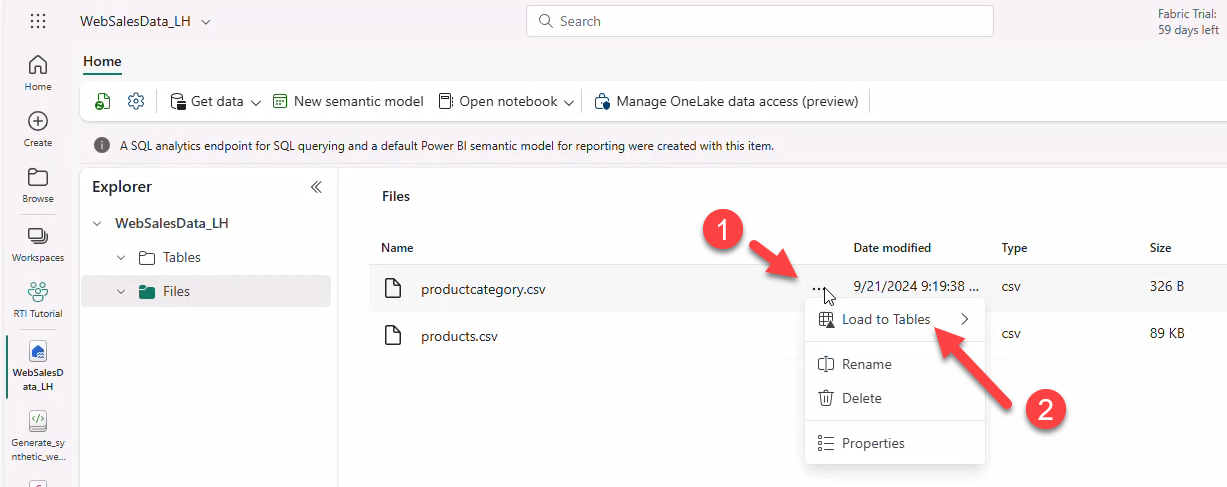
- Click Get data → Upload Files → select both CSV files → Upload.
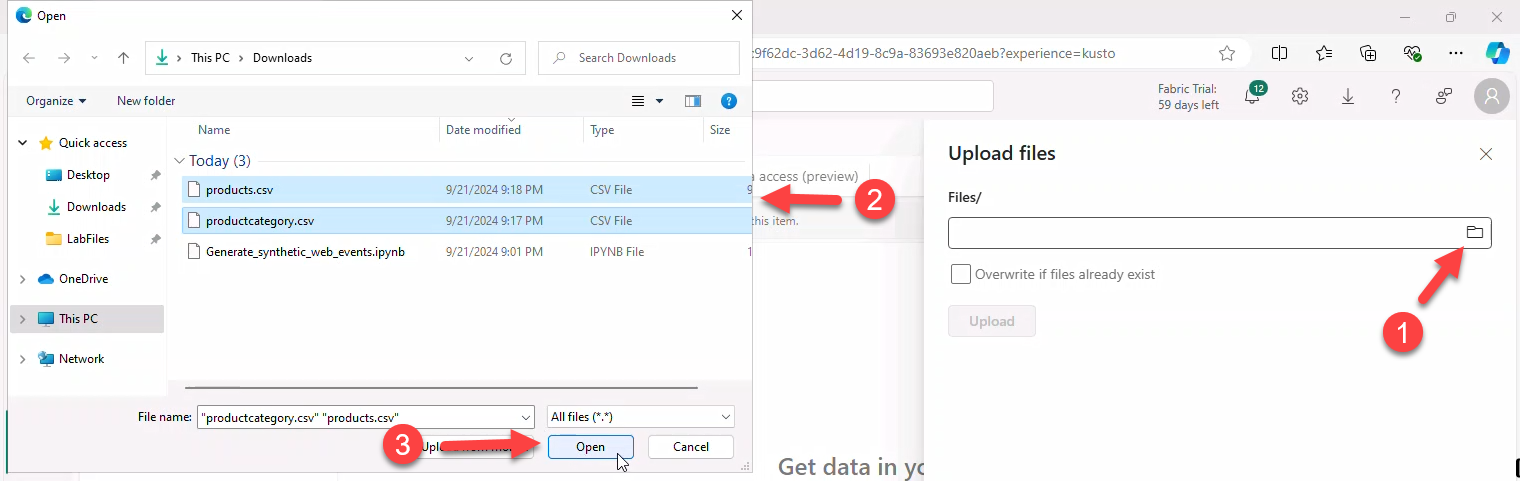
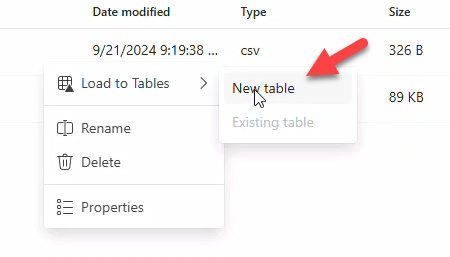
- For each file, use Load to tables → New table → retain defaults → Load.
Note
Repeat for productcategory.csv and products.csv.
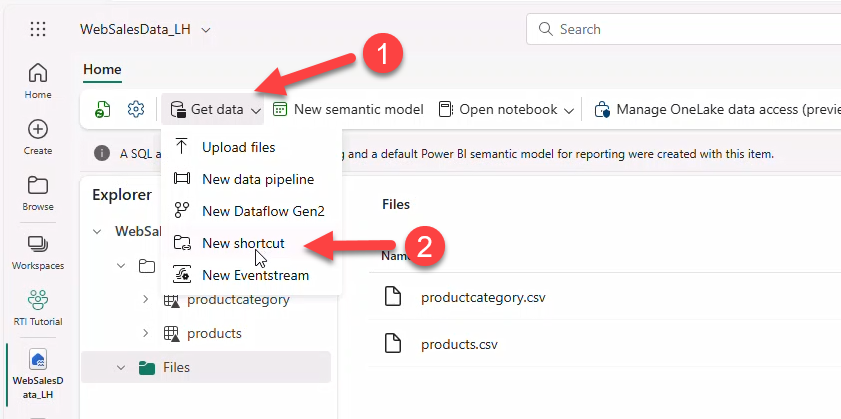
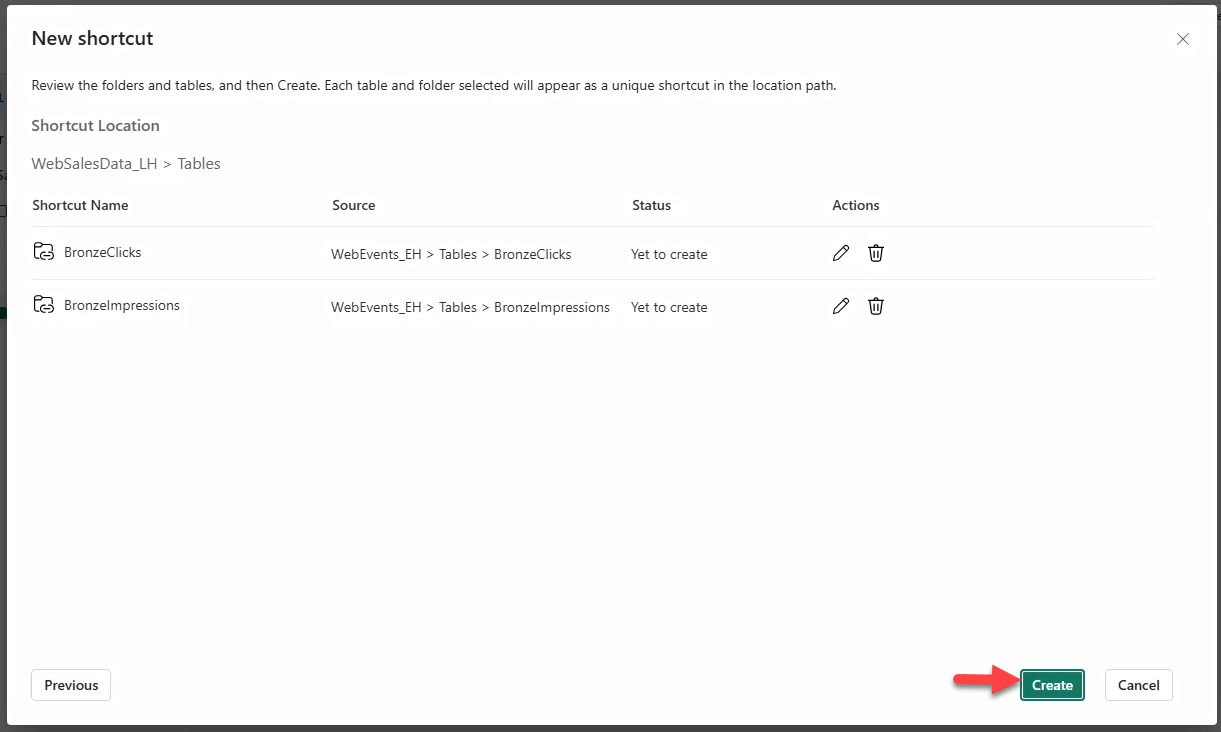
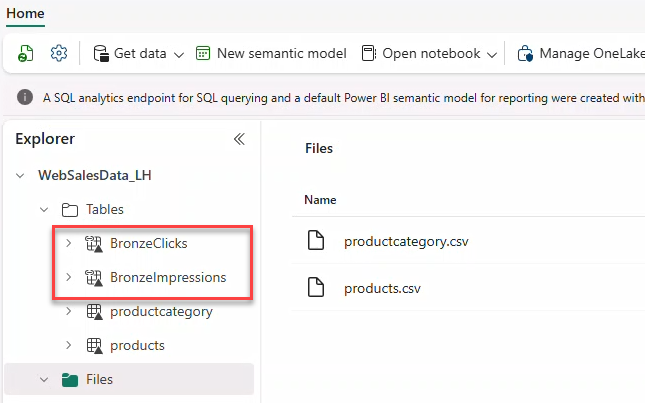
11. Accessing Eventhouse data from the Lakehouse
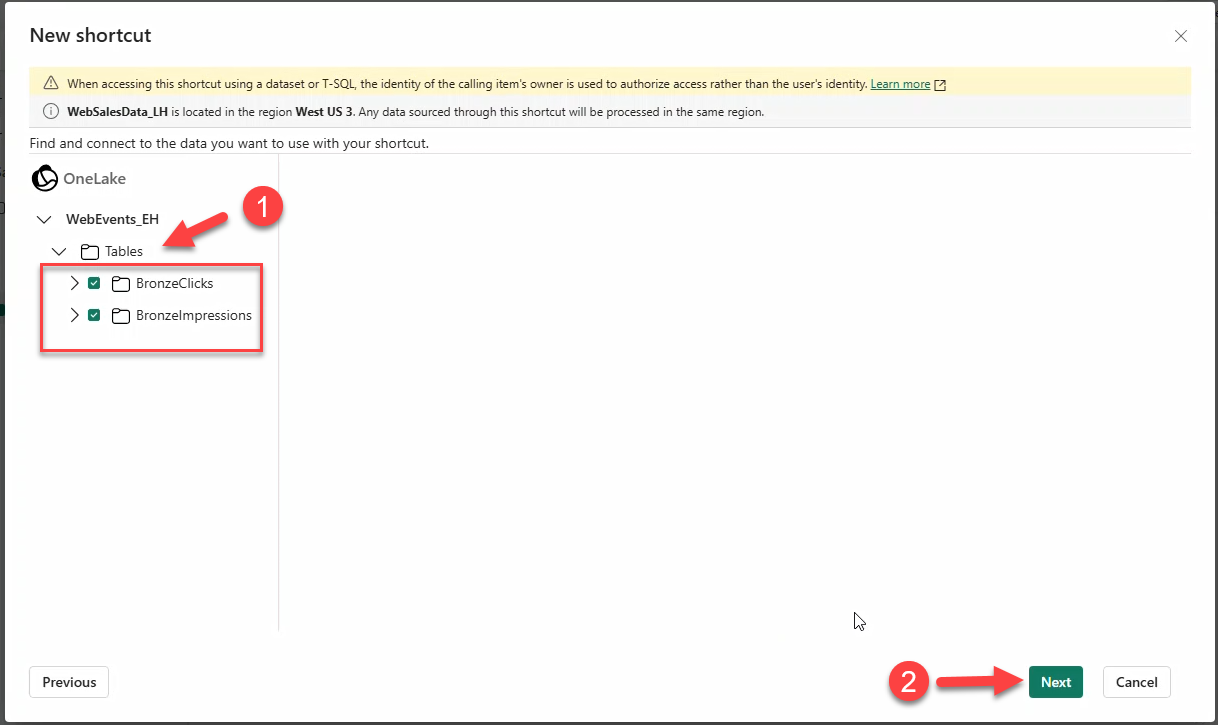
Create OneLake shortcuts for BronzeClicks and BronzeImpressions.
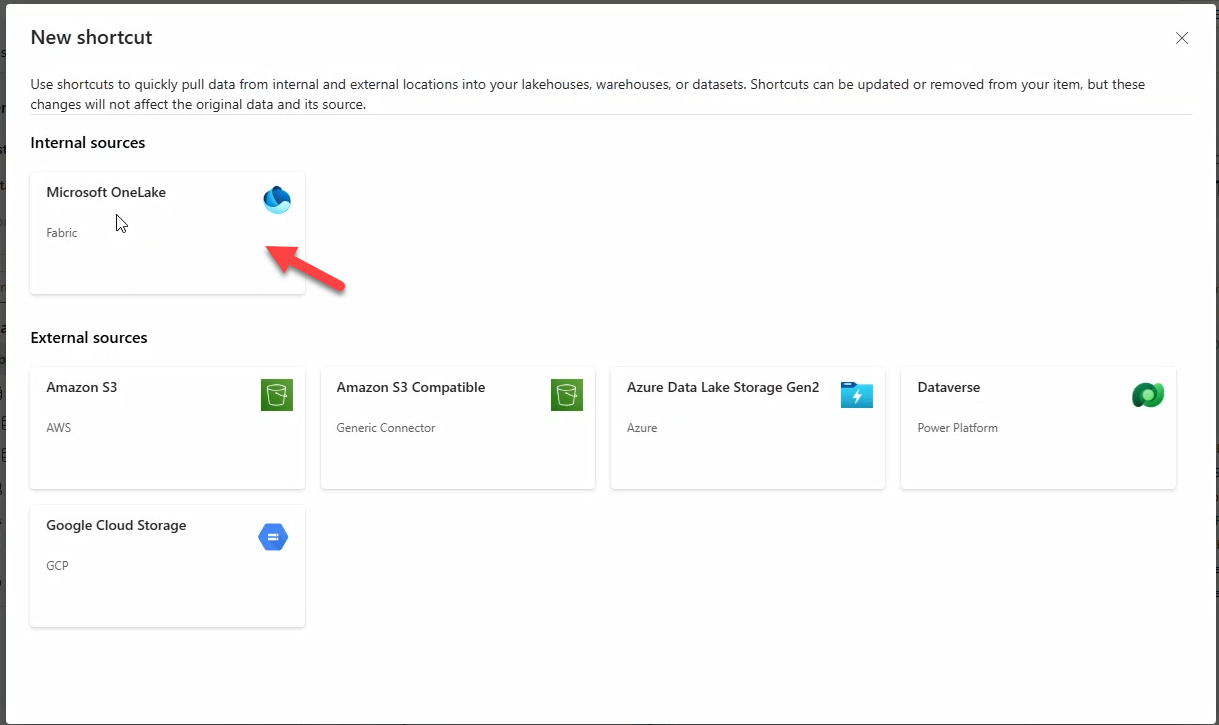
- Get data → New shortcut (or New table shortcut under schema).
- Select Microsoft OneLake.
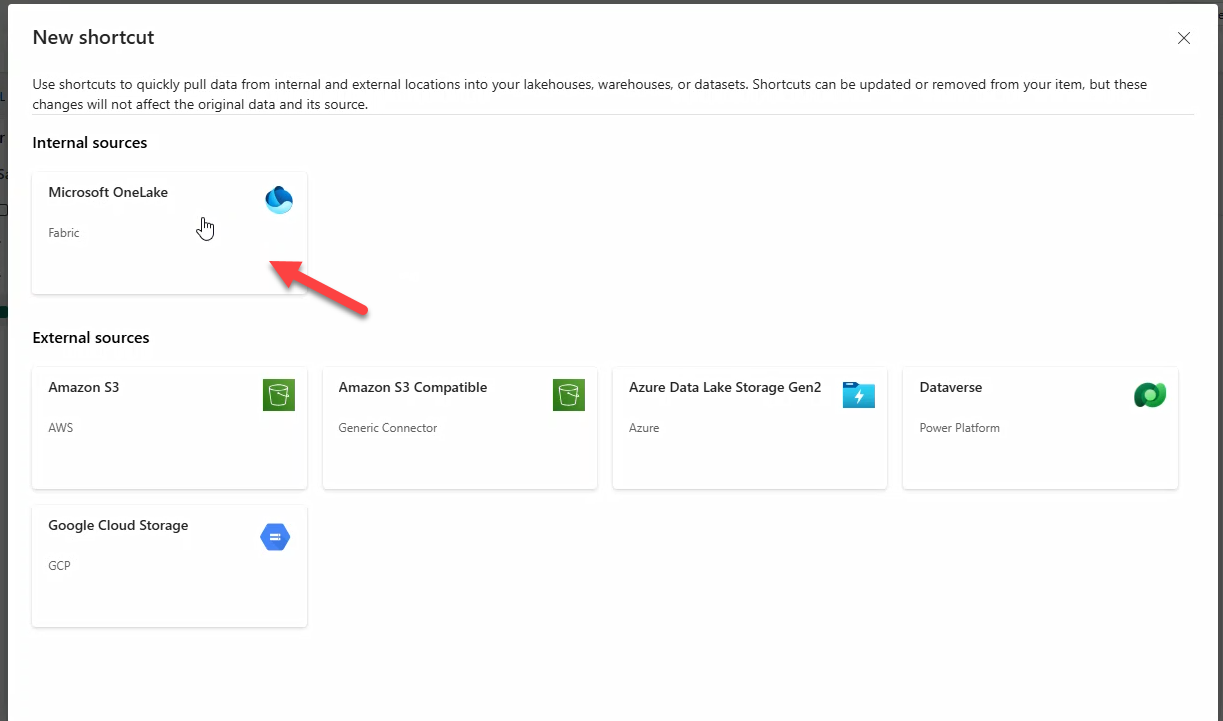
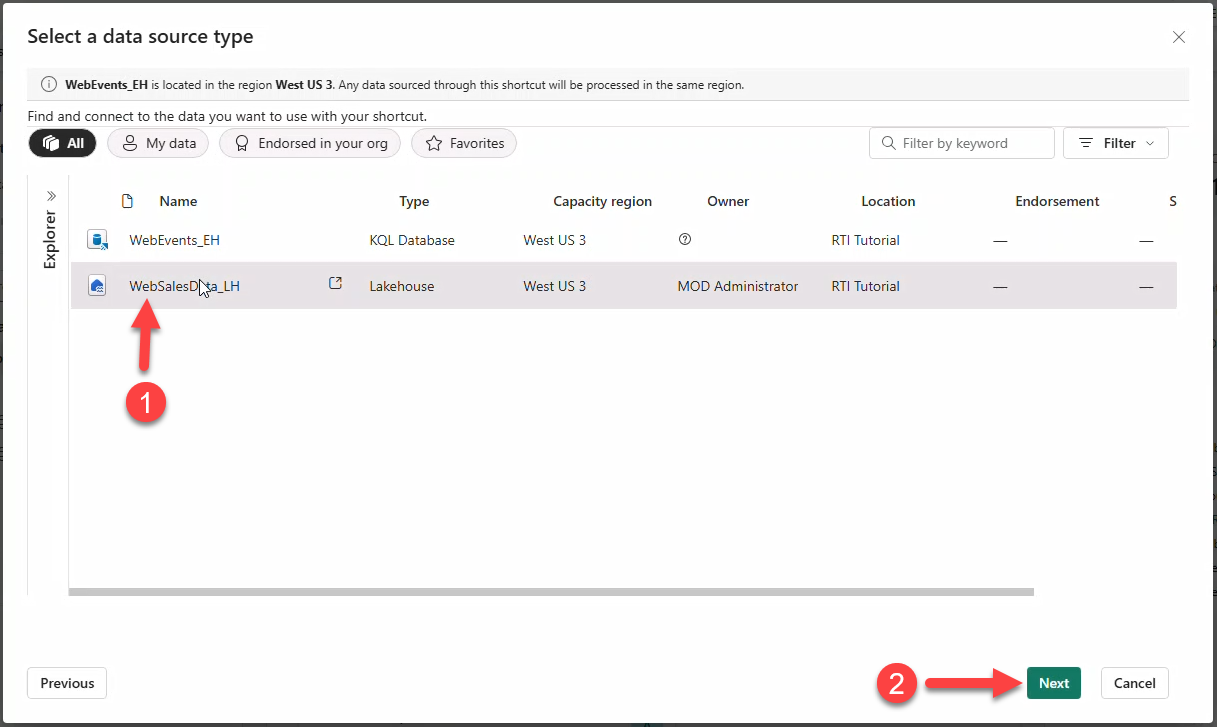
- Choose KQL Database WebEvents_EH → Next.
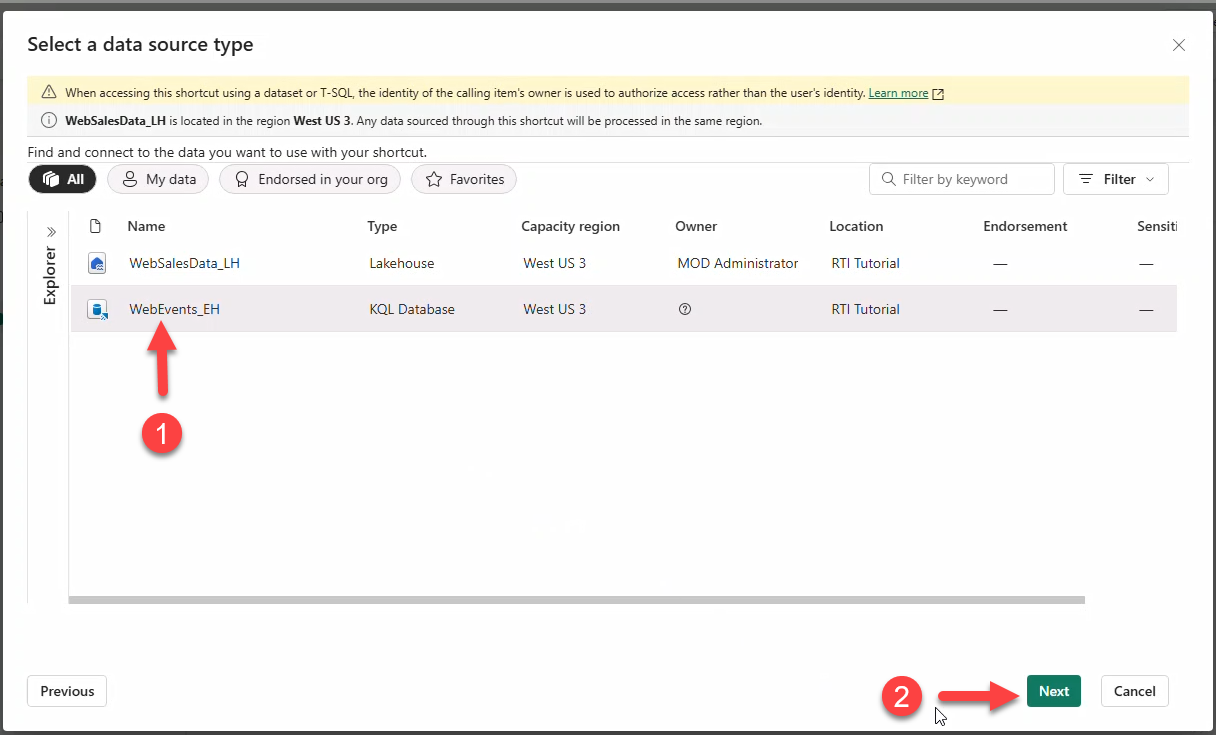
- Check tables BronzeClicks and BronzeImpressions → Next → Create.
Note
Shortcuts have a different icon than regular delta tables.
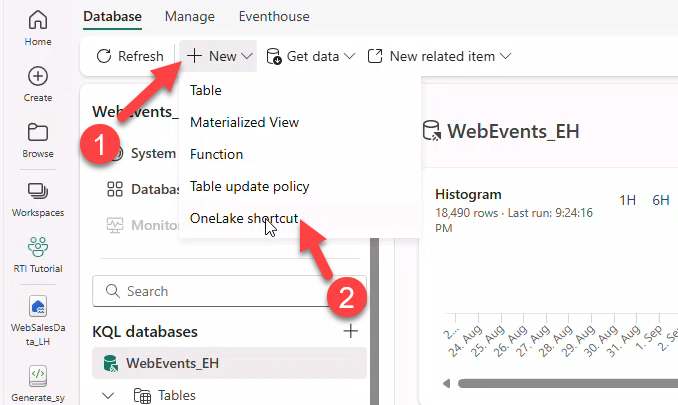
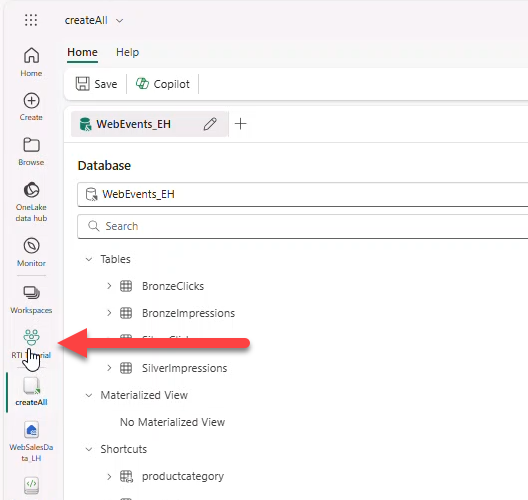
12. Build the KQL DB schema
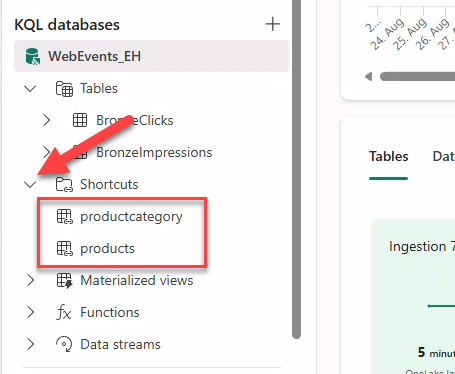
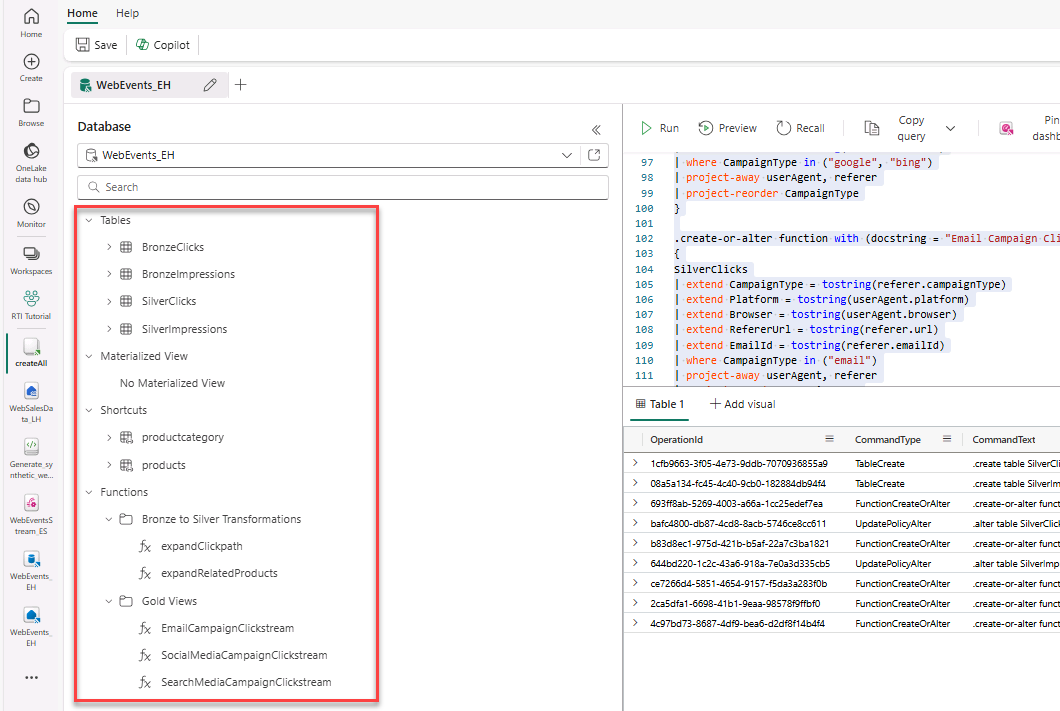
Create silver tables, functions, and update policies. Add OneLake shortcuts for products and productcategory from the lakehouse.
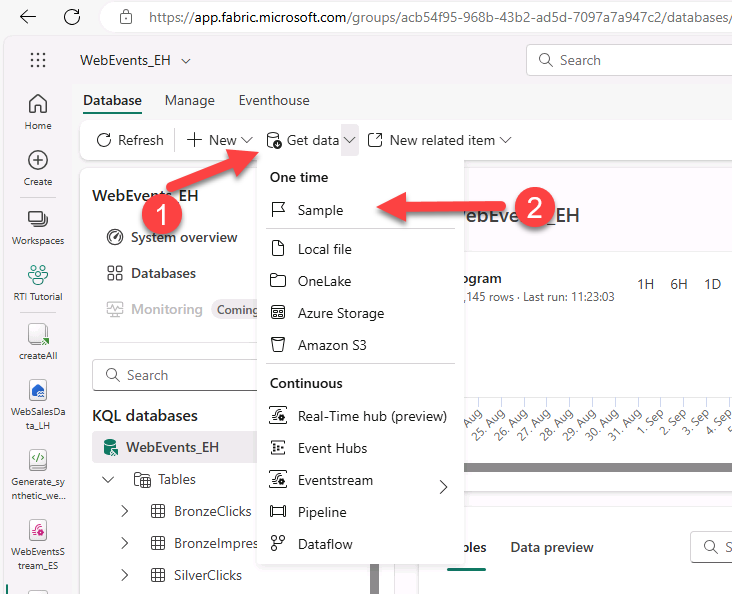
- Open KQL Database WebEvents_EH → + New → OneLake shortcut.
Note
Data has already streamed into your KQL-Database; see the overview dashboard.
- Select Microsoft OneLake → lakehouse WebSalesData_LH → Next.
- Add shortcut to table products (repeat for productcategory).
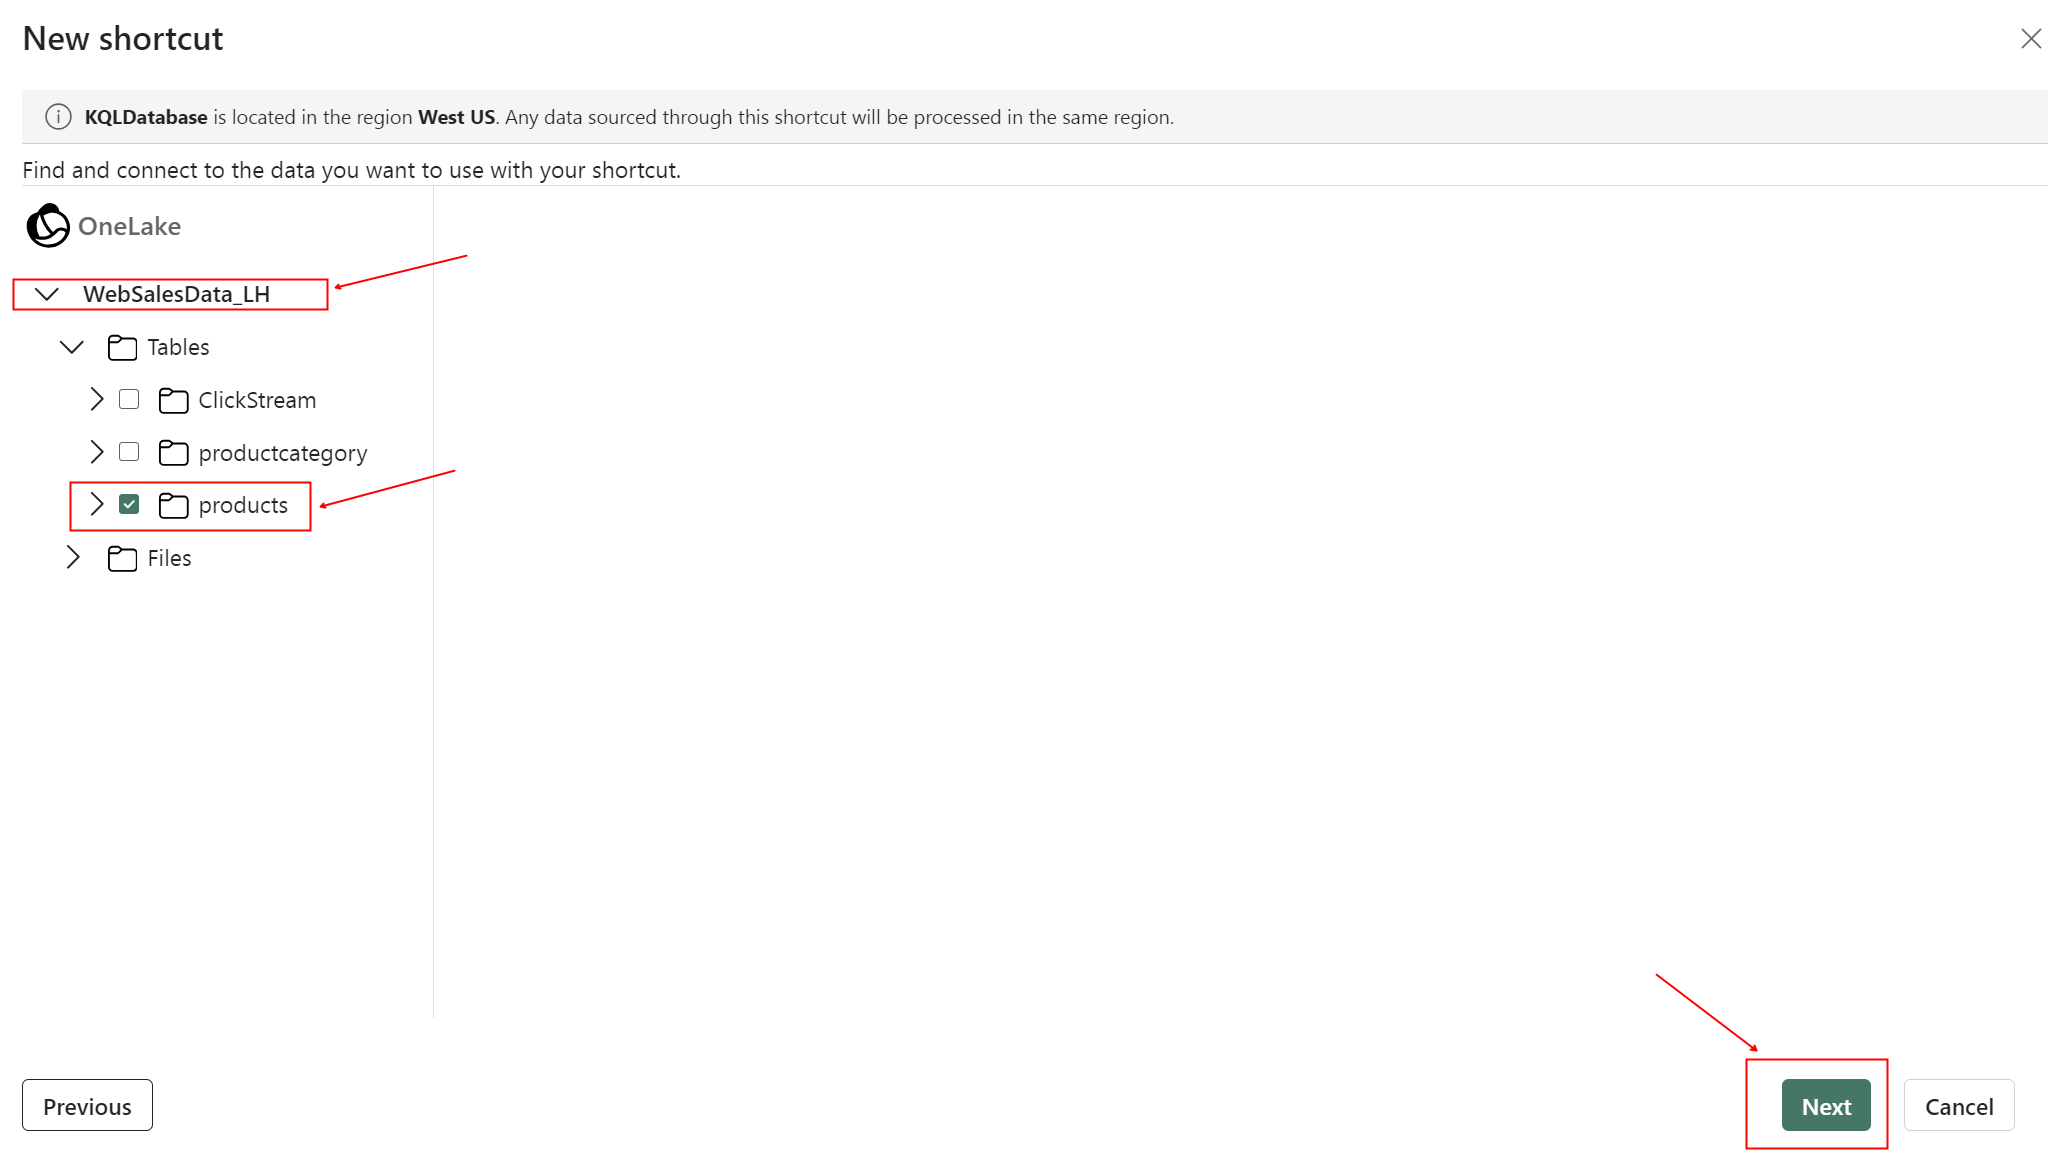
Note
Repeat the steps for productcategory.
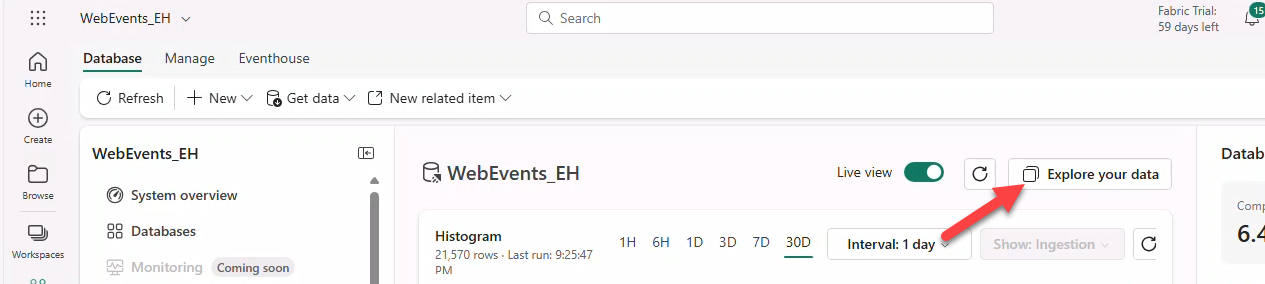
- Click Explore your Data.
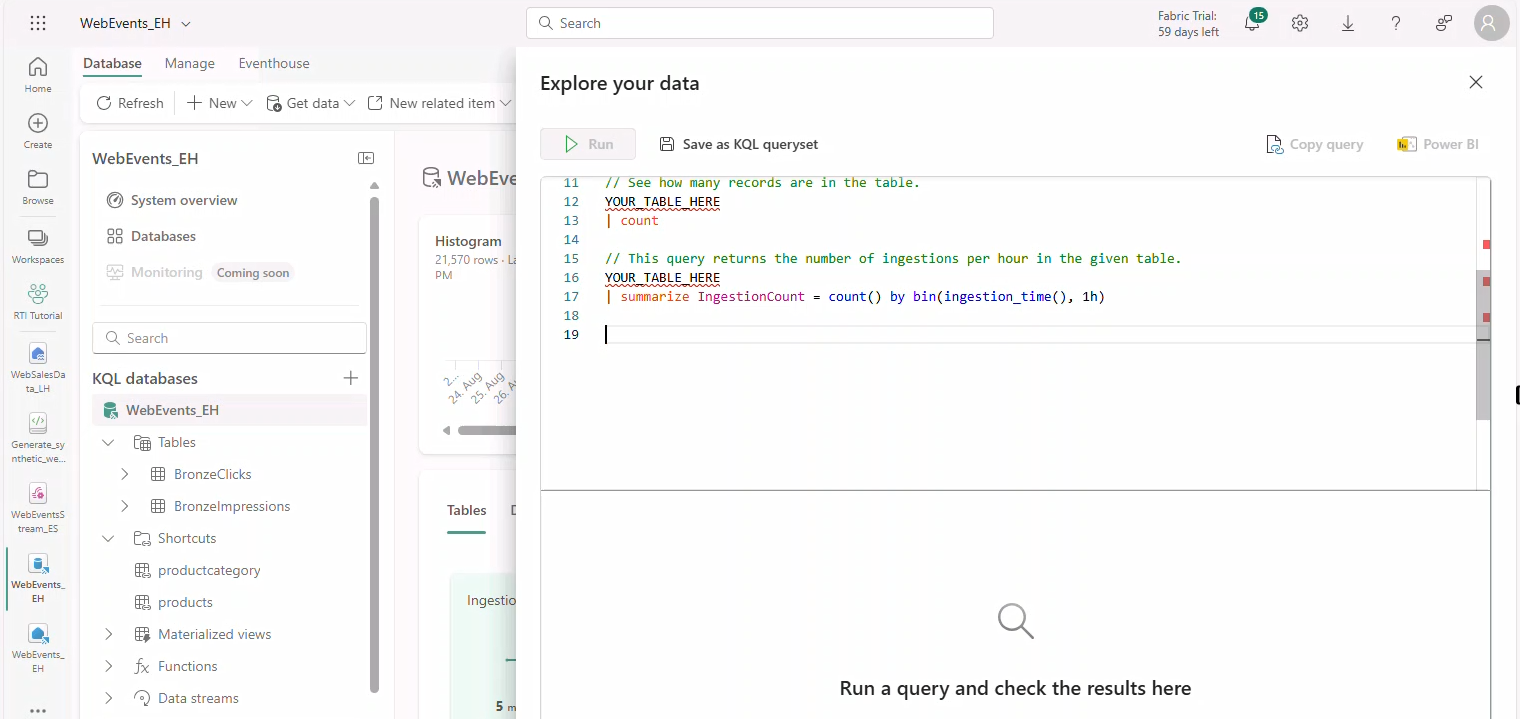
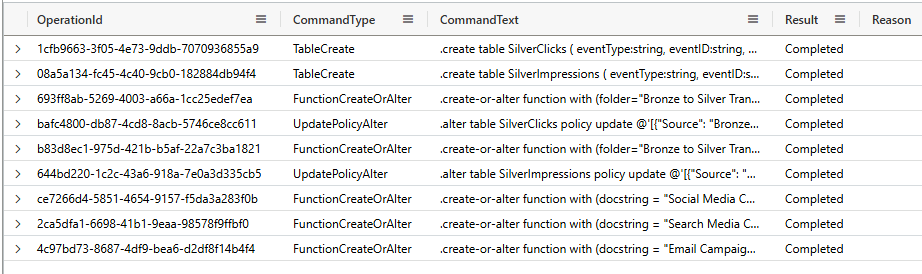
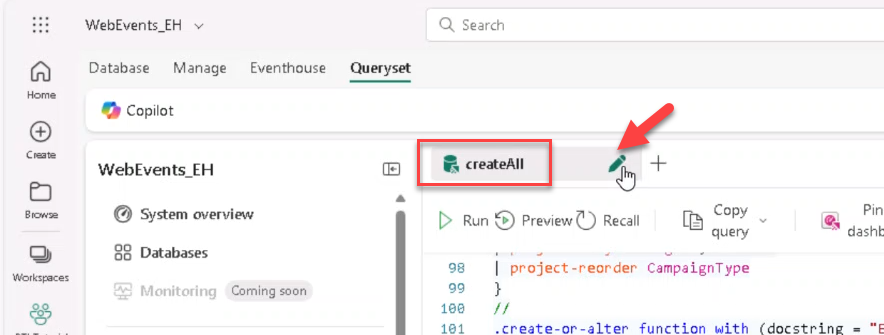
- Open createAll.kql from GitHub and copy contents.
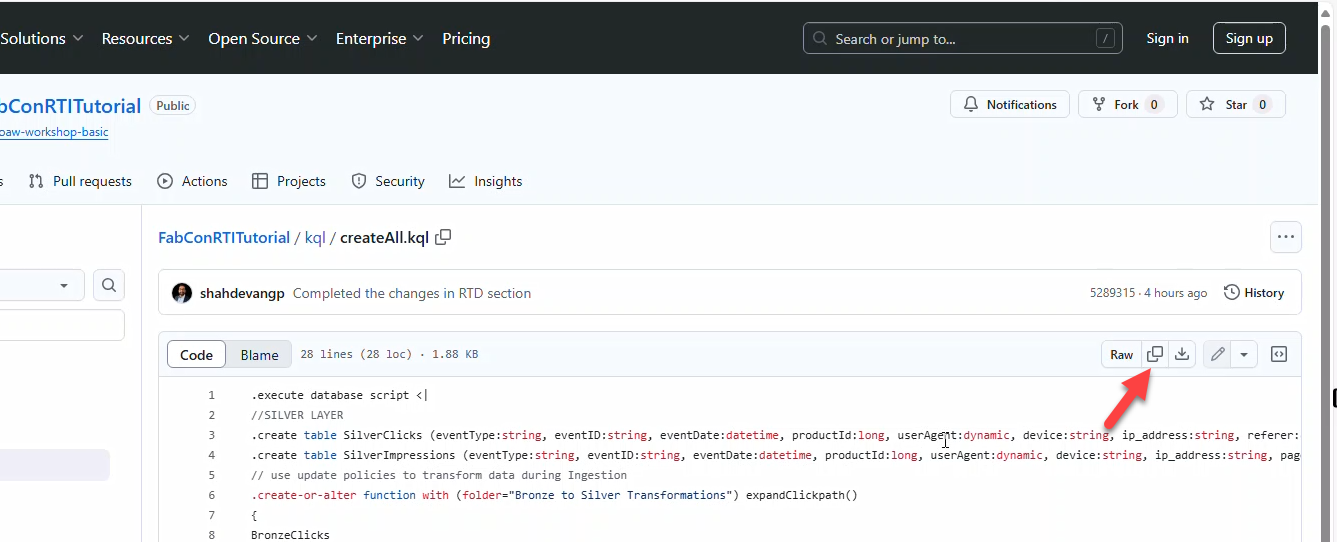
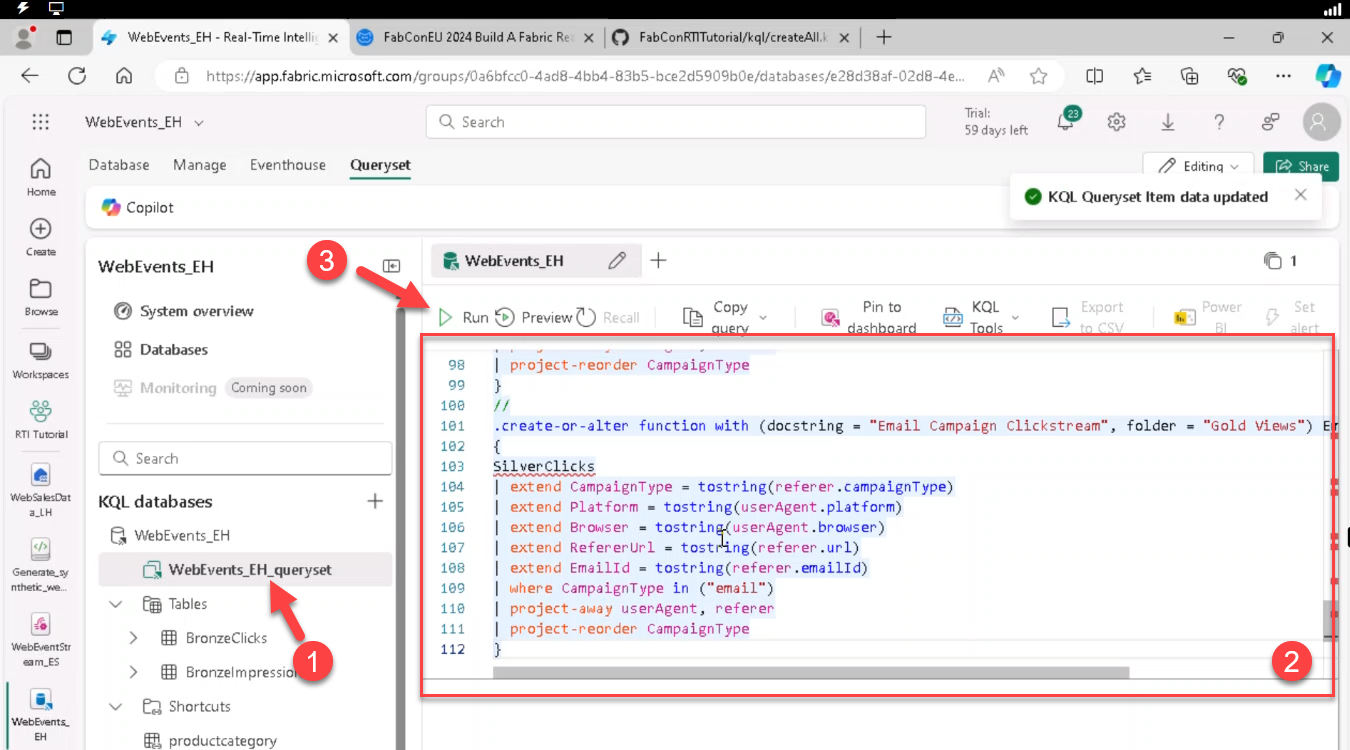
- Open queryset WebEvents_EH_queryset, paste contents, Run. Rename tab to createAll.
Note
You can add additional tabs in the KQL Queryset to add new queries.
- Expand folders to verify all tables and functions created by the script.
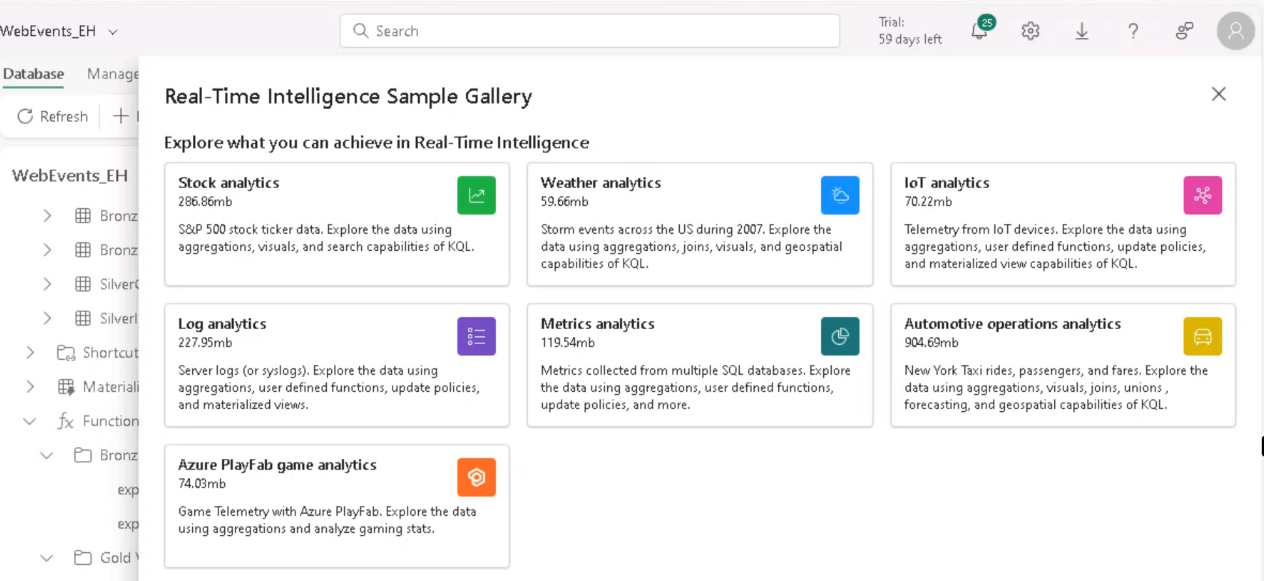
Note
Explore additional Real-Time Intelligence Samples via Get data menu.
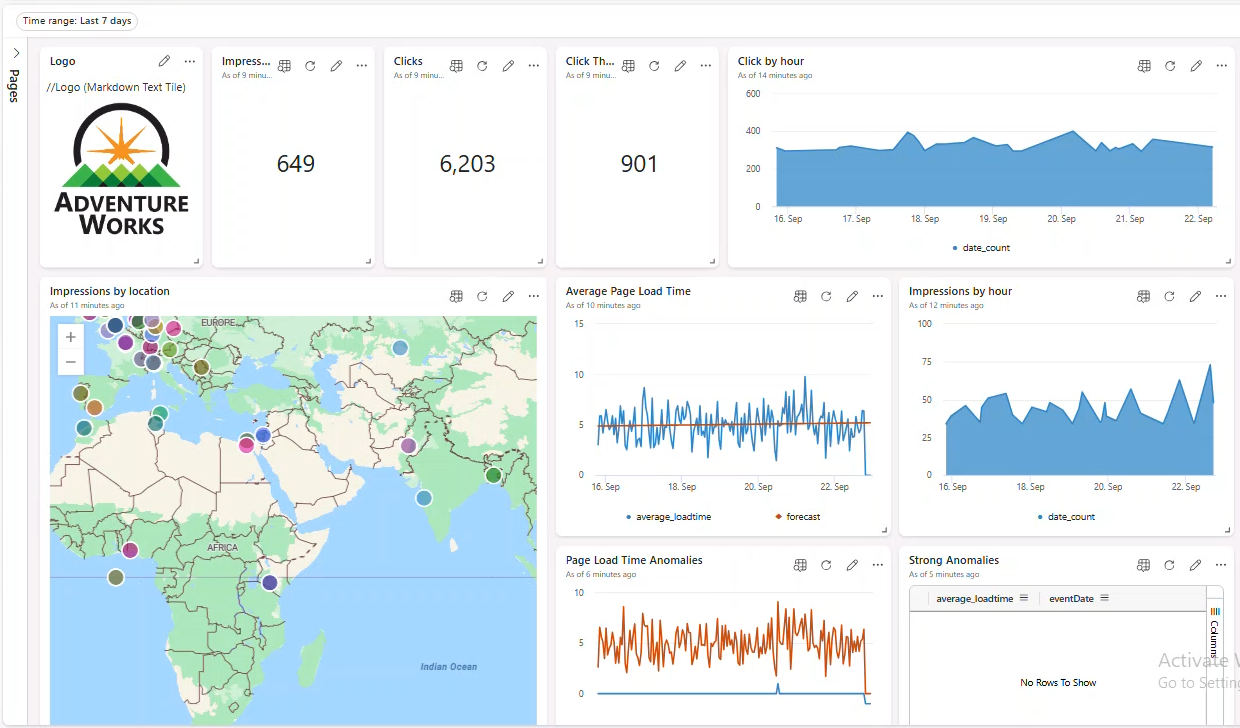
13. Real-Time Dashboard
Build a dashboard to visualize streaming data and set auto-refresh to 30 seconds (or Continuous). Optionally import a pre-built JSON definition.
Note
The Proctor Guide covers this process.
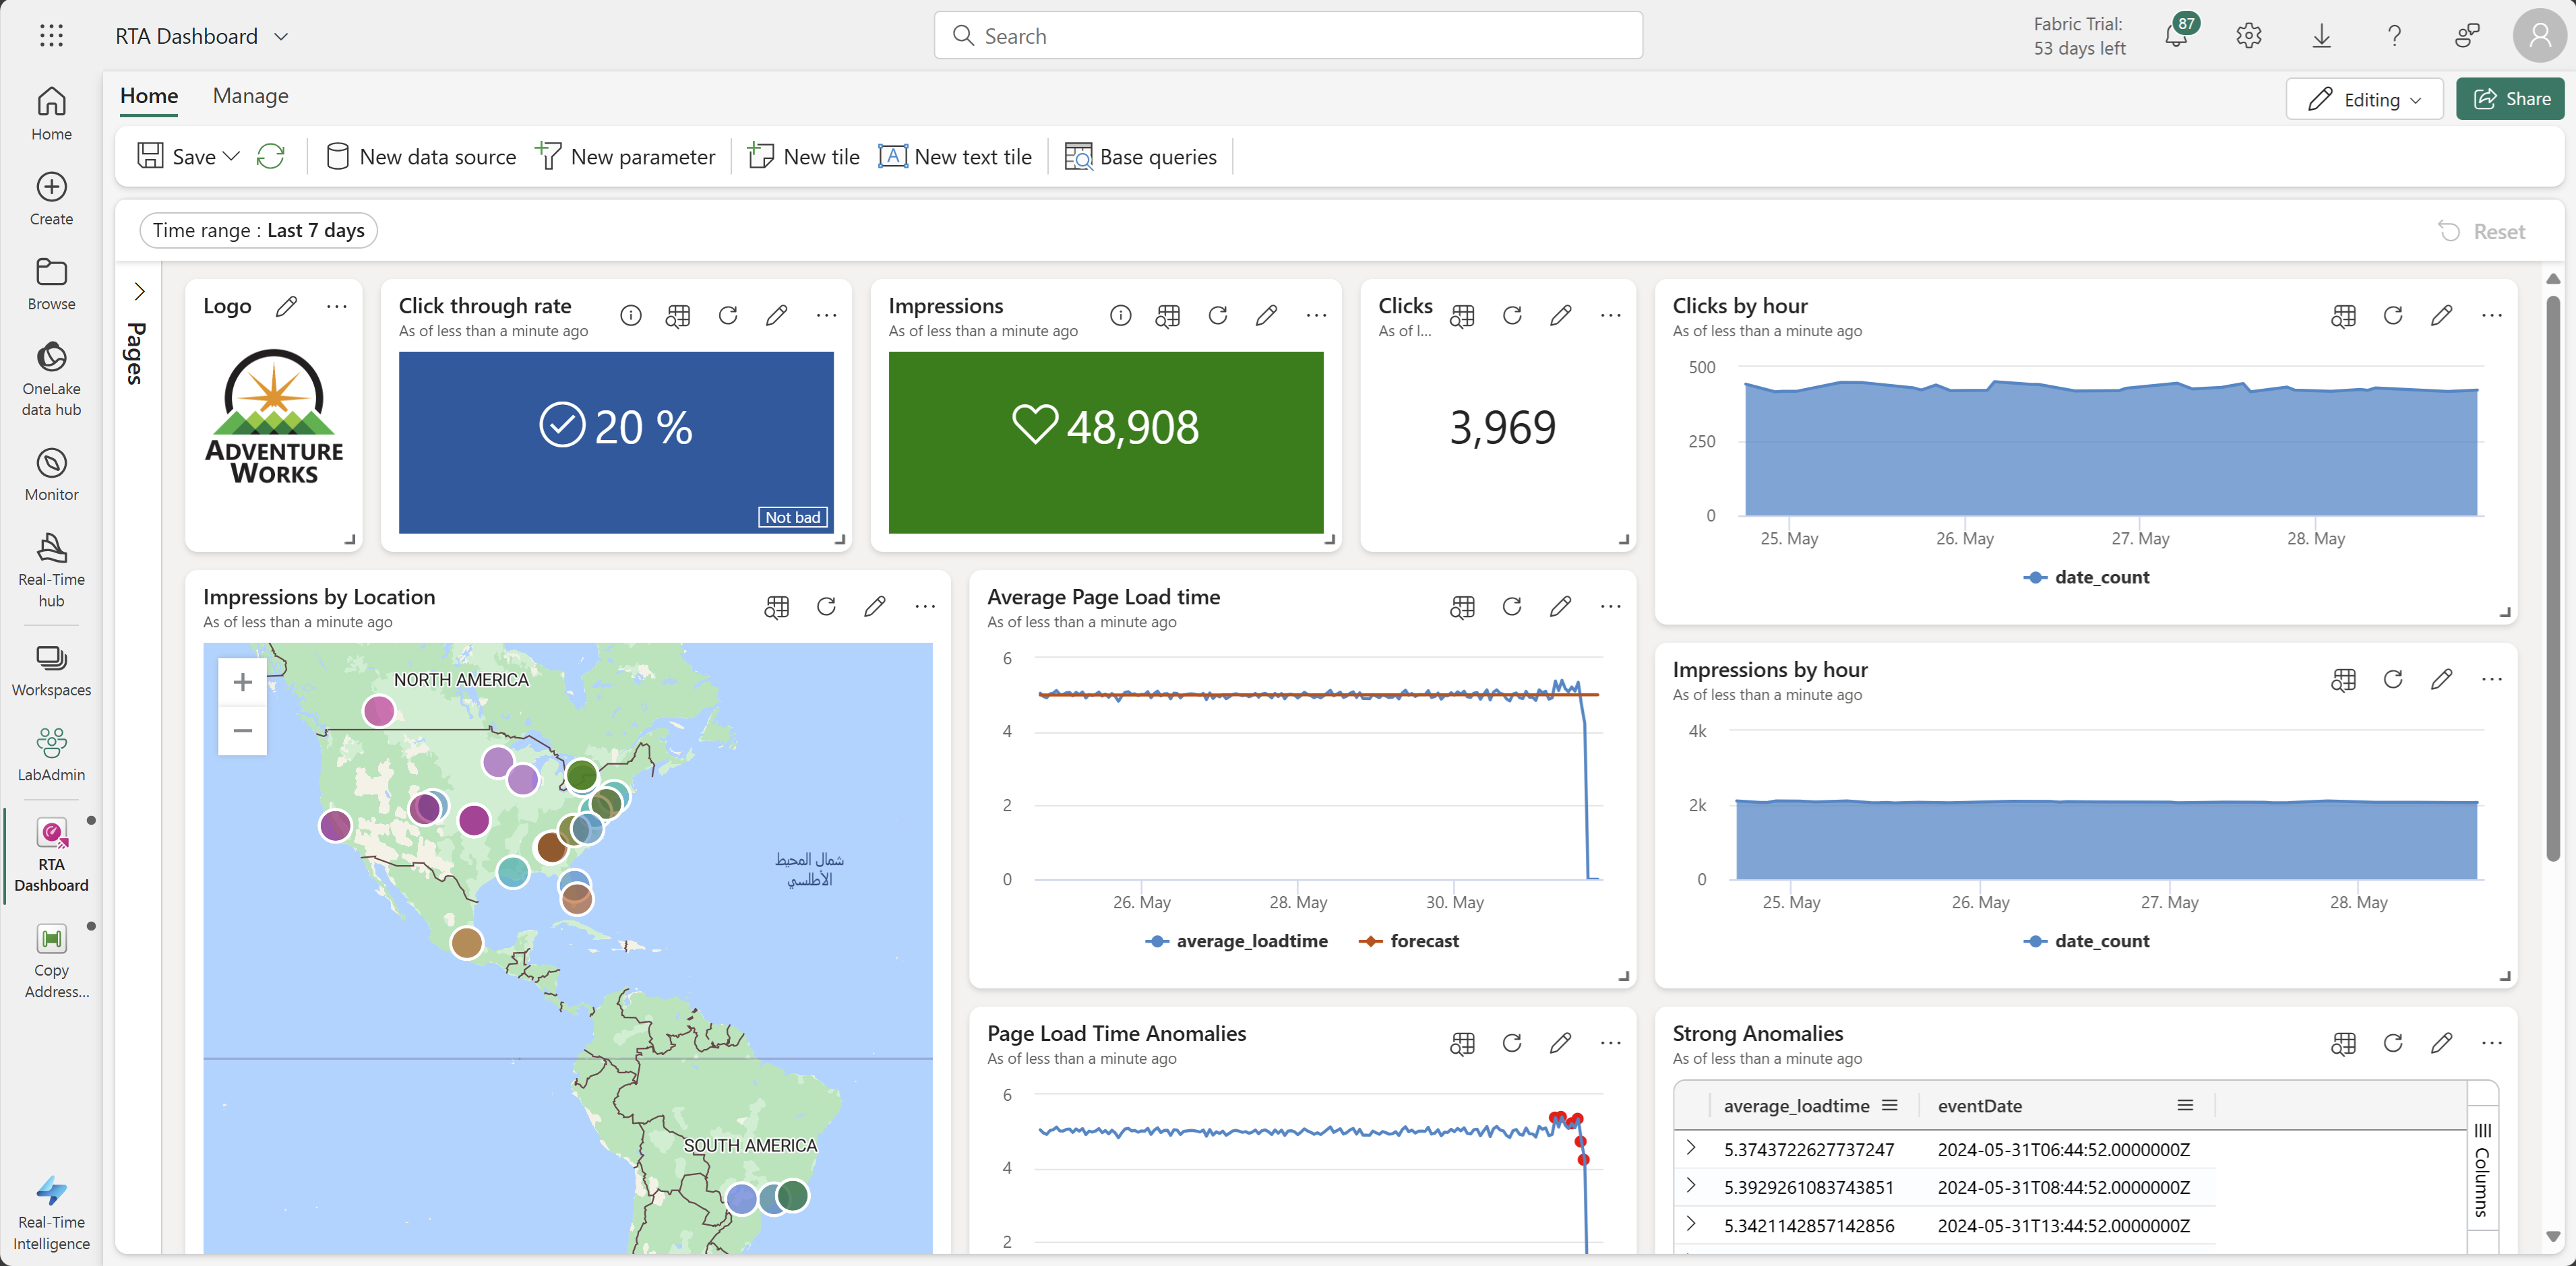
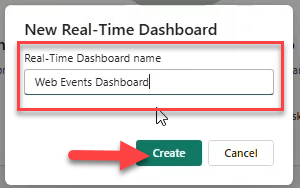
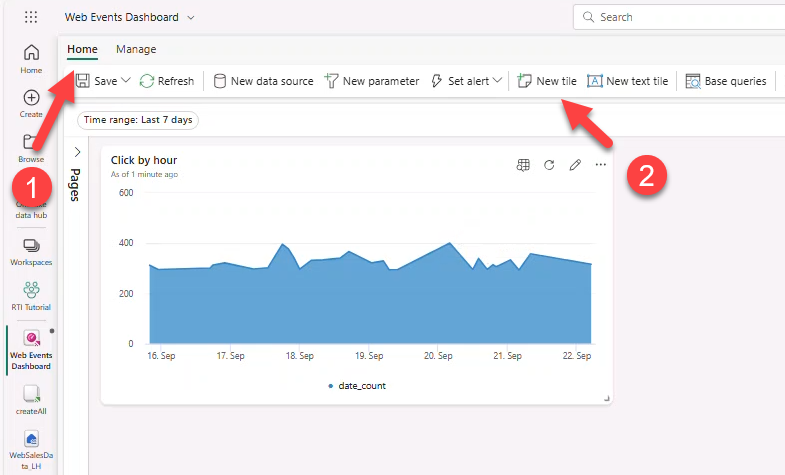
- Workspace → + New Item → Real-Time Dashboard → name
Web Events Dashboard.
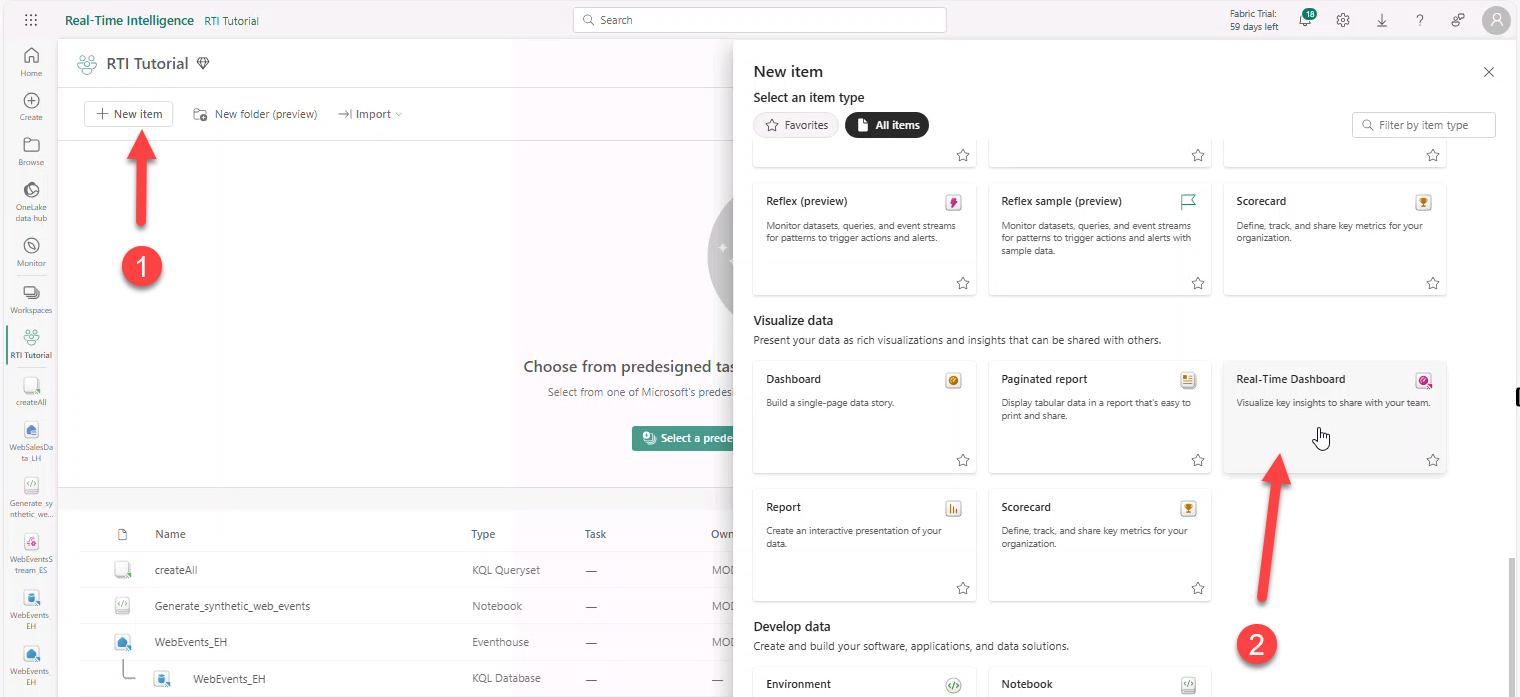
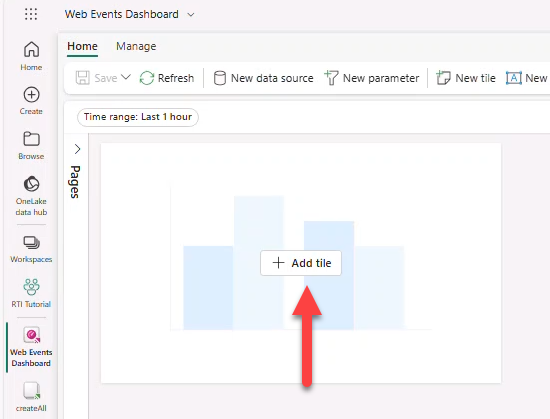
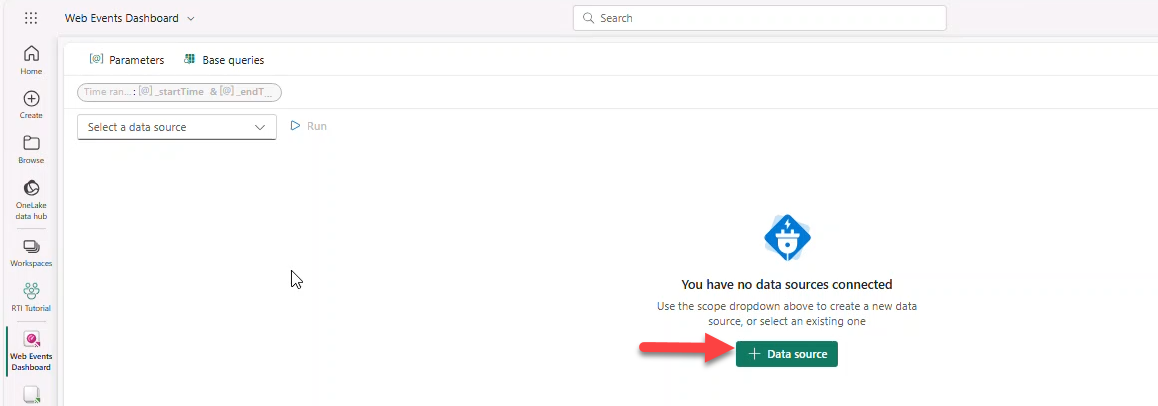
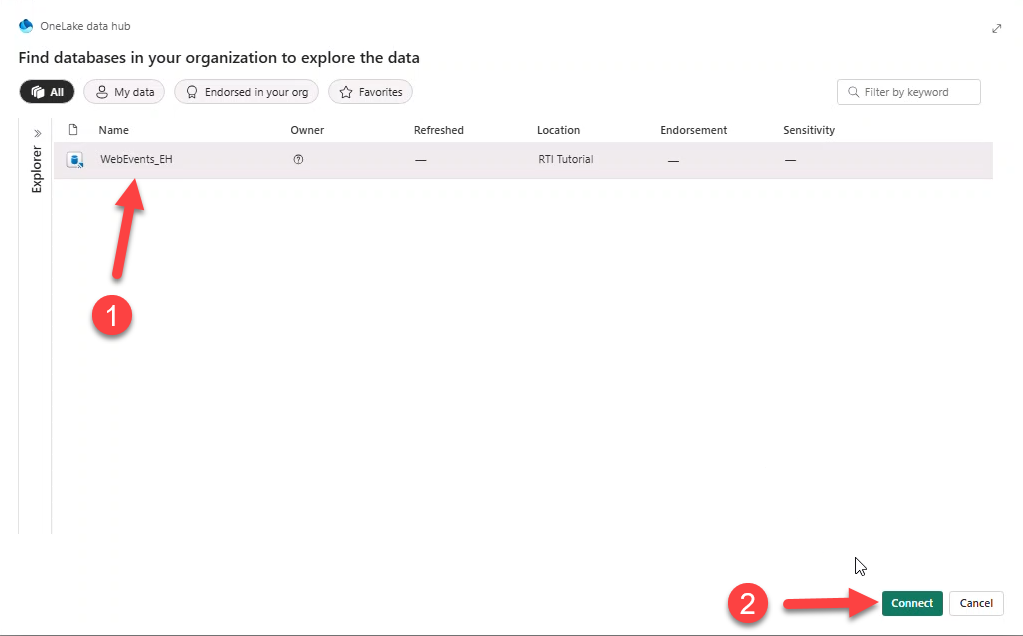
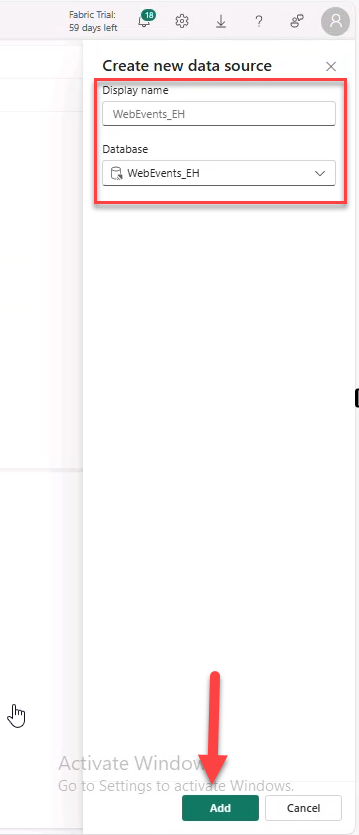
- + Add tile → + Data source → select Eventhouse WebEvents_EH → Add.
Proceed to paste each query below, add a visual, and apply changes. Optionally use script file dashboard-RTA.kql.
Note
We demo the first visual; repeat steps for the rest.
Clicks by hour
//Clicks by hour
SilverClicks
| where eventDate between (_startTime.._endTime)
| summarize date_count = count() by bin(eventDate, 1h)
| render timechart
| top 30 by date_count- Set time range to Last 7 days → Run → + Add Visual.
- Title:
Click by hour. Visual type: Area chart → Apply changes.
Note
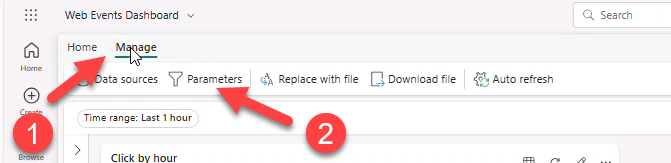
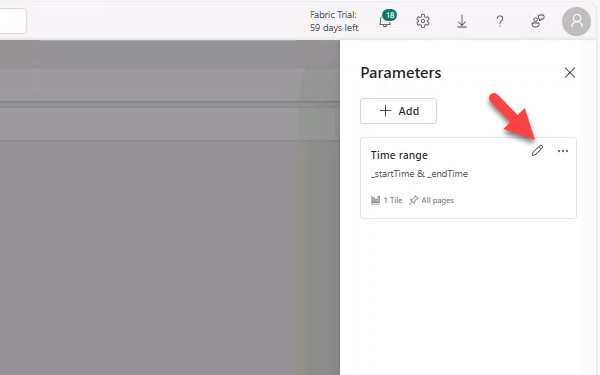
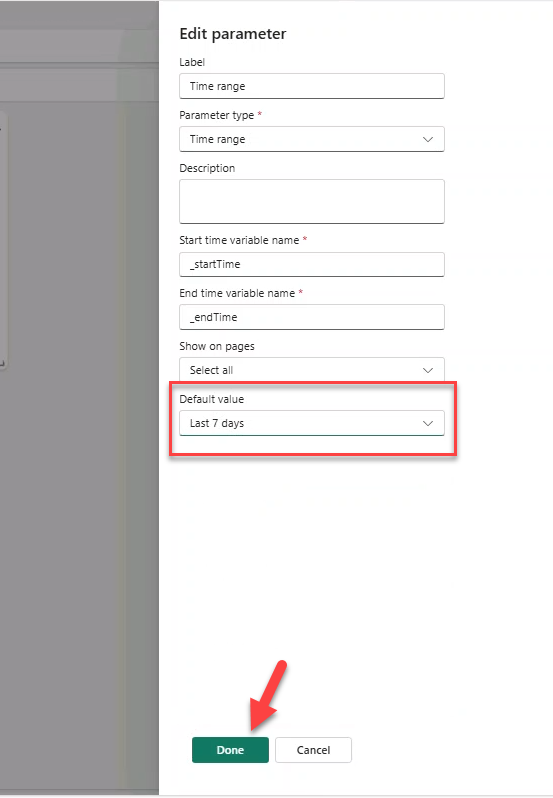
After Apply, the range may reset to 1 hour; we fix via Parameters.
- Manage → Parameters → edit Time range default to Last 7 Days.
Impressions by hour
//Impressions by hour
SilverImpressions
| where eventDate between (_startTime.._endTime)
| summarize date_count = count() by bin(eventDate, 1h)
| render timechart
| top 30 by date_count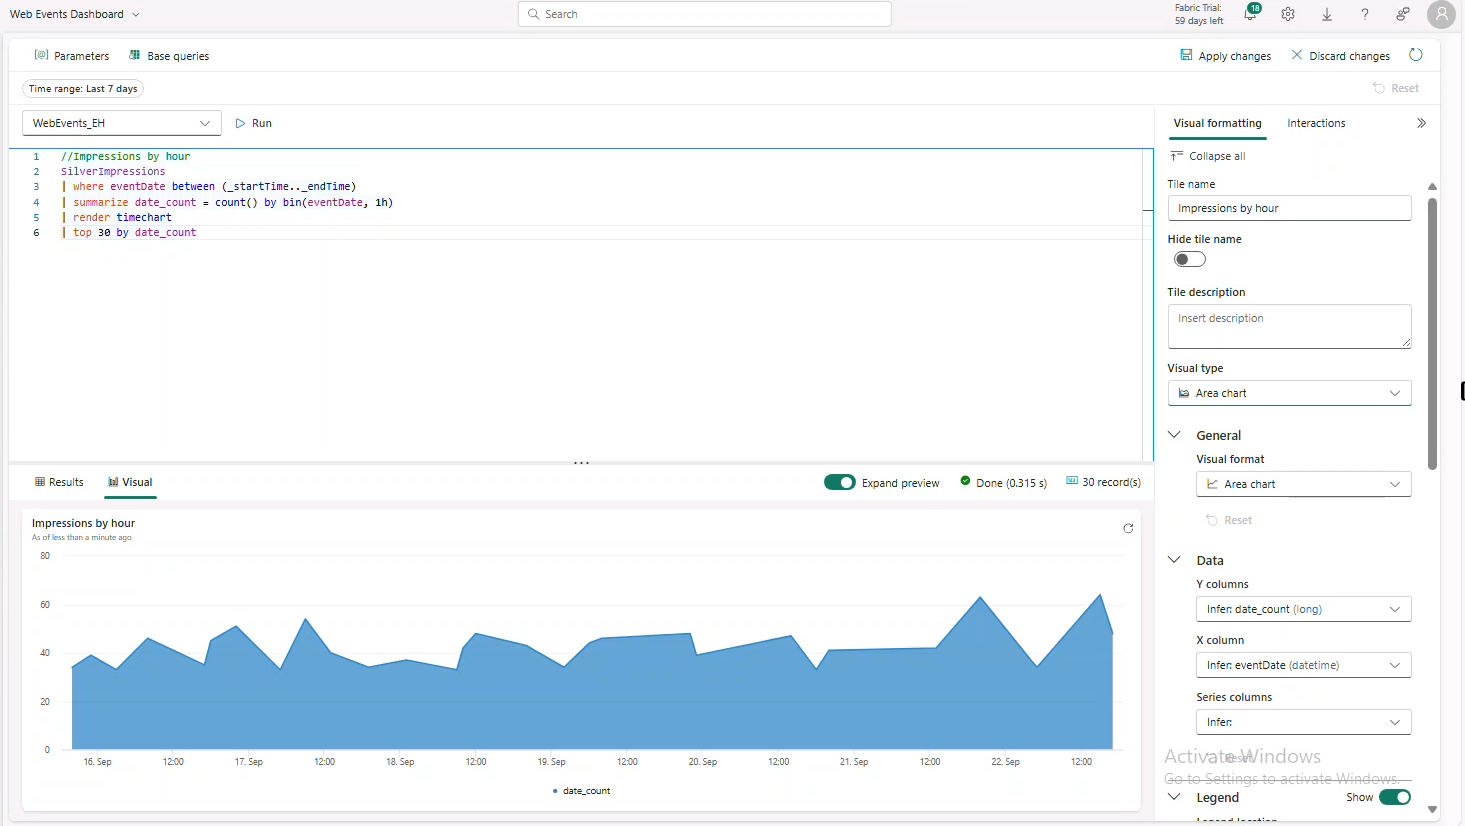
Impressions by location
//Impressions by location
SilverImpressions
| where eventDate  between (_startTime.._endTime)
| join external_table('products') on $left.productId == $right.ProductID
| project lon = toreal(geo_info_from_ip_address(ip_address).longitude), lat = toreal(geo_info_from_ip_address(ip_address).latitude), Name
| render scatterchart with (kind = map)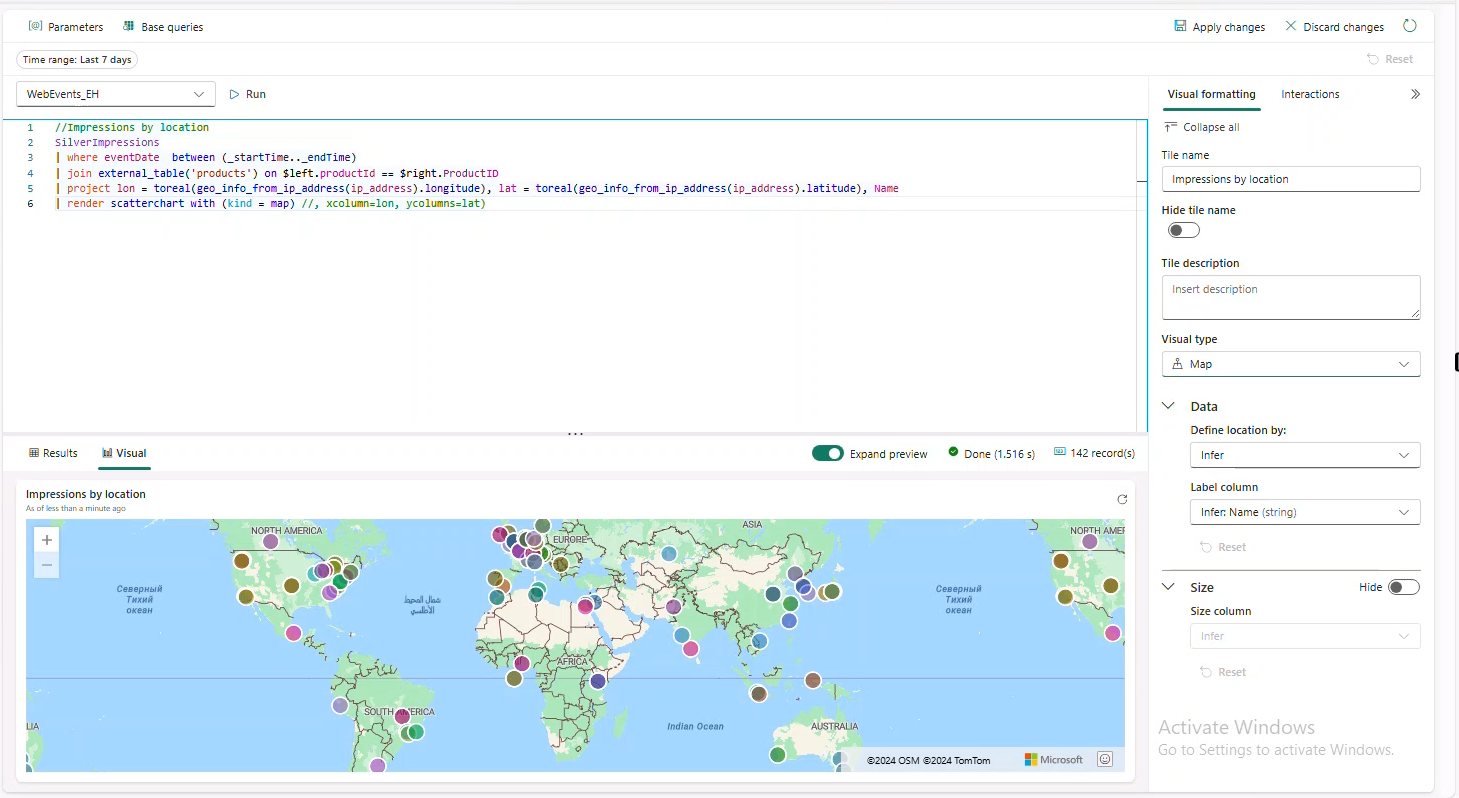
Average Page Load time
//Average Page Load time
SilverImpressions
| where eventDate   between (_startTime.._endTime)
| make-series average_loadtime = avg(page_loading_seconds) on eventDate from _startTime to _endTime+4h step 1h
| extend forecast = series_decompose_forecast(average_loadtime, 4)
| render timechart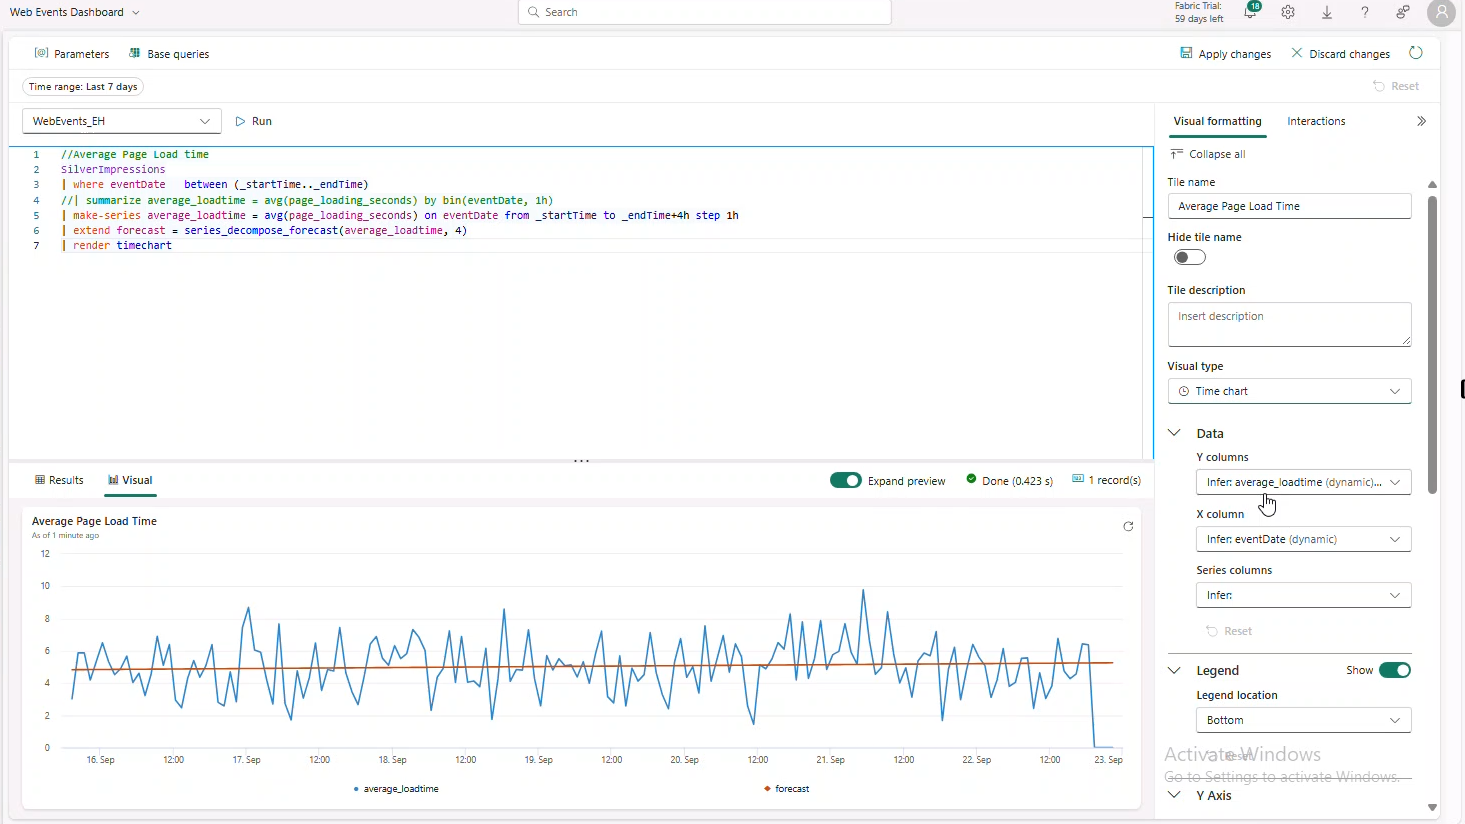
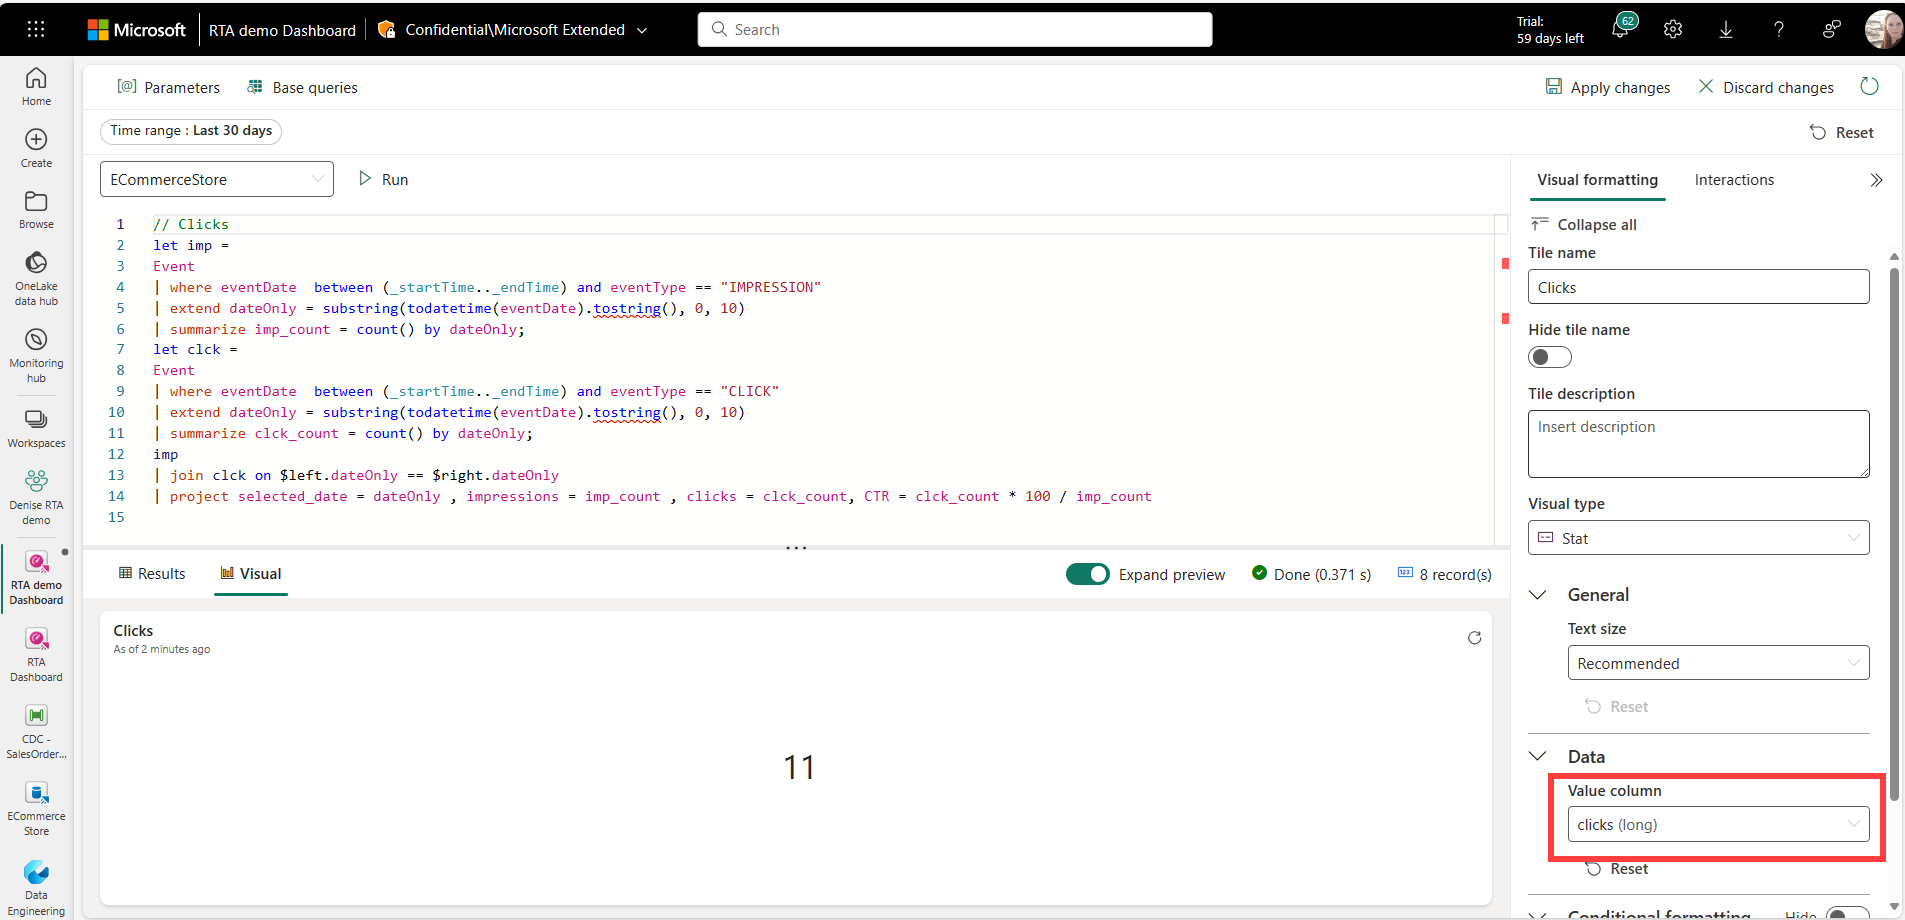
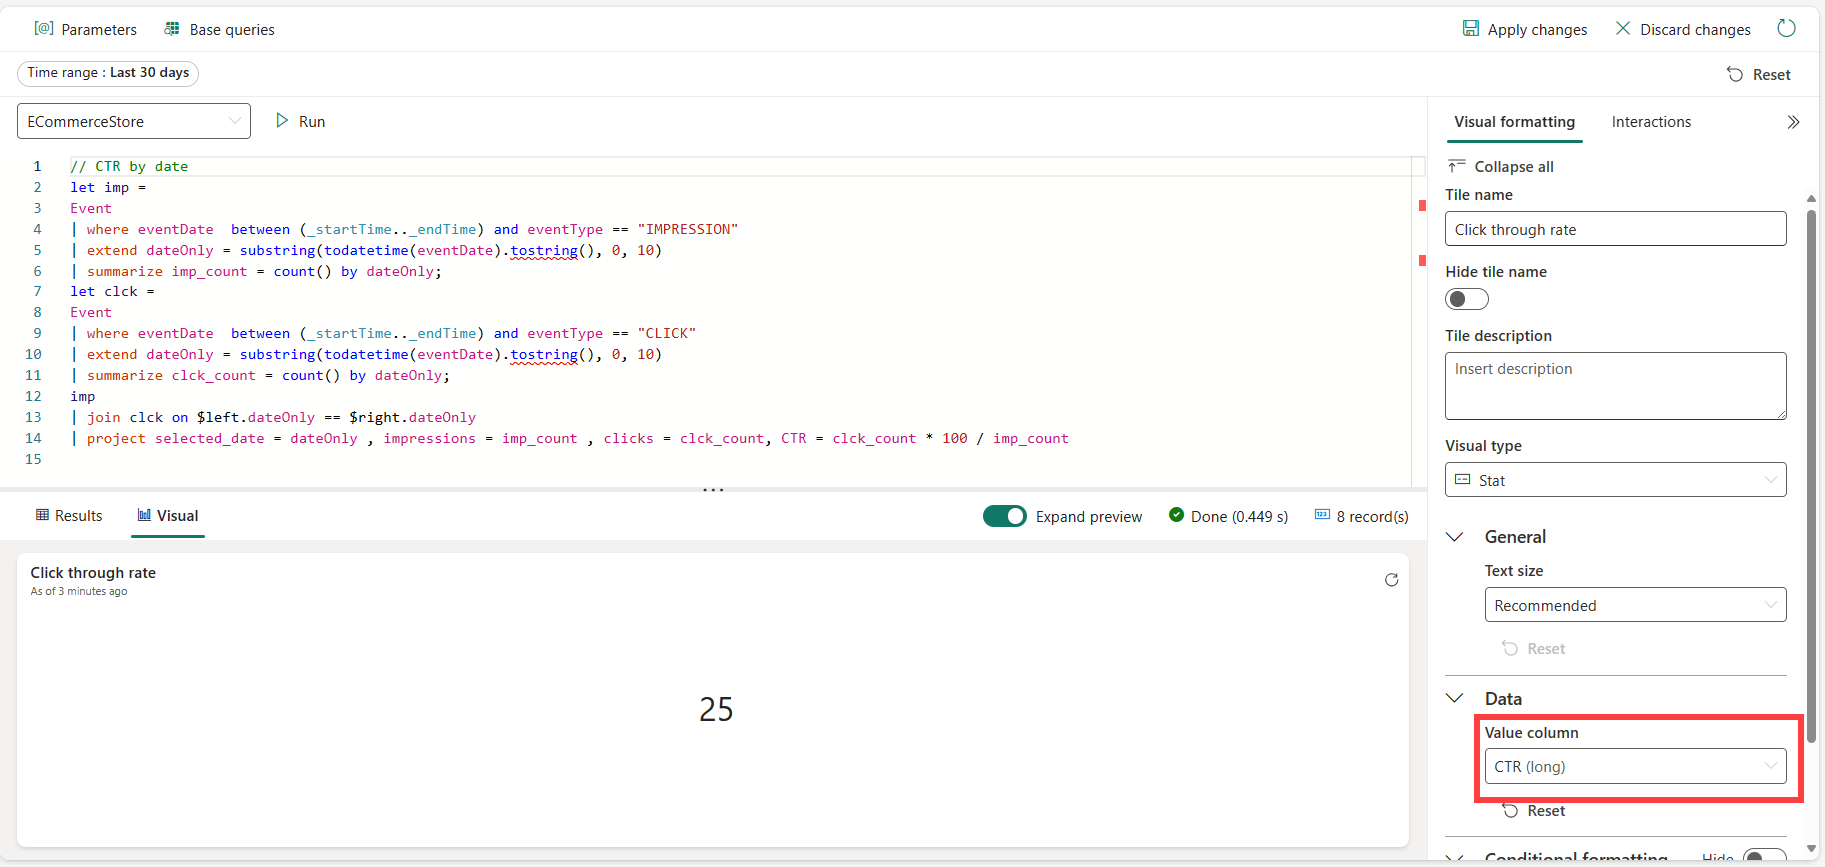
Impressions, Clicks & CTR
//Clicks, Impressions, CTR
let imp =  SilverImpressions
| where eventDate  between (_startTime.._endTime)
| extend dateOnly = substring(todatetime(eventDate).tostring(), 0, 10)
| summarize imp_count = count() by dateOnly;
let clck = SilverClicks
| where eventDate  between (_startTime.._endTime)
| extend dateOnly = substring(todatetime(eventDate).tostring(), 0, 10)
| summarize clck_count = count() by dateOnly;
imp
| join clck on $left.dateOnly == $right.dateOnly
| project selected_date = dateOnly , impressions = imp_count , clicks = clck_count, CTR = clck_count * 100 / imp_count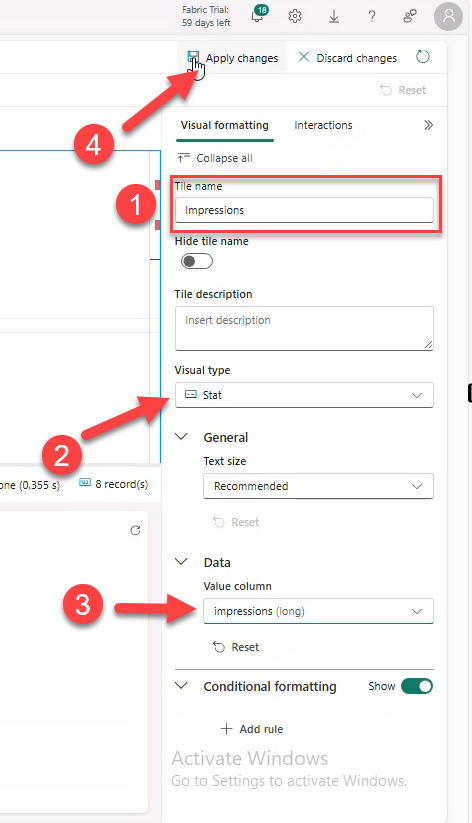
Average Page Load Time Anomalies
//Avg Page Load Time Anomalies
SilverImpressions
| where eventDate   between (_startTime.._endTime)
| make-series average_loadtime = avg(page_loading_seconds) on eventDate from _startTime to _endTime+4h step 1h
| extend anomalies = series_decompose_anomalies(average_loadtime)
| render anomalychart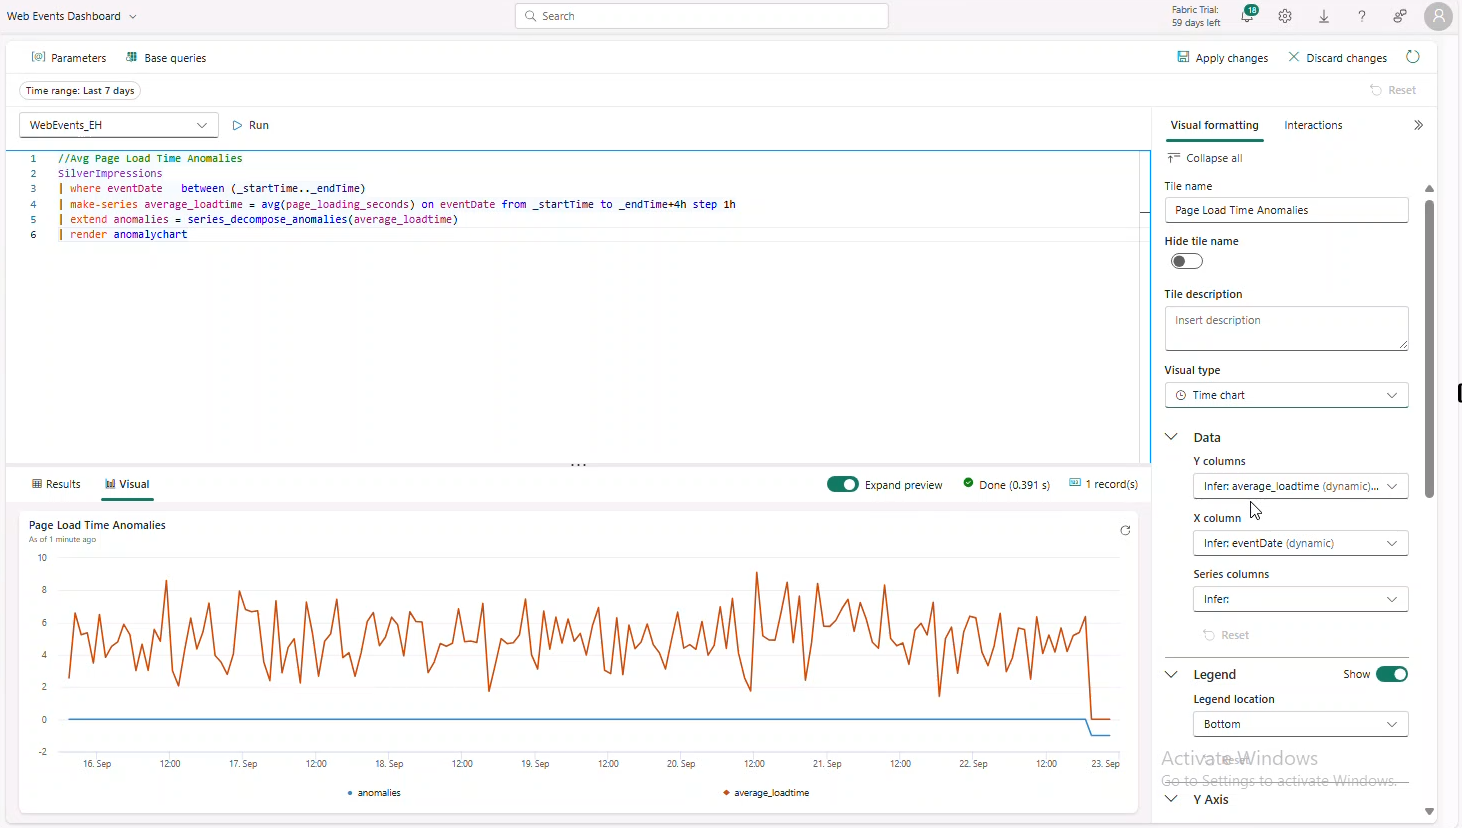
Strong Anomalies
//Strong Anomalies
SilverImpressions
| where eventDate between (_startTime.._endTime)
| make-series average_loadtime = avg(page_loading_seconds) on eventDate from _startTime to _endTime+4h step 1h
| extend anomalies = series_decompose_anomalies(average_loadtime,2.5)
| mv-expand eventDate, average_loadtime, anomalies
| where anomalies <> 0
| project-away anomalies
Logo (Markdown Text Tile)
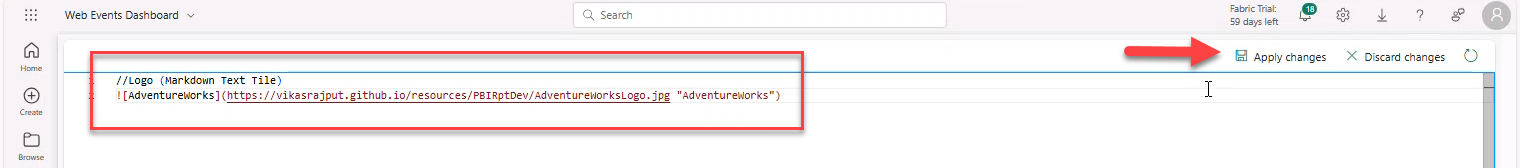
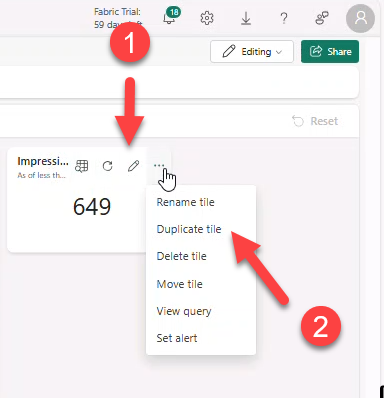
Arrange visuals; the dashboard should look similar to:
Auto-refresh
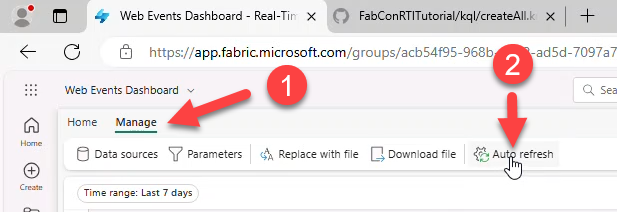
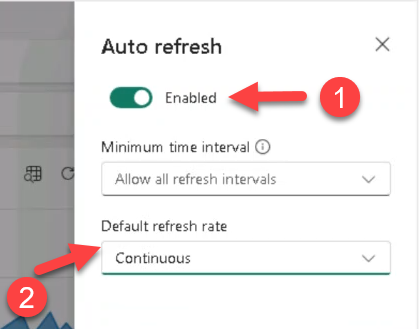
- Manage → Auto refresh → Enabled → Default refresh rate: Continuous → Apply.
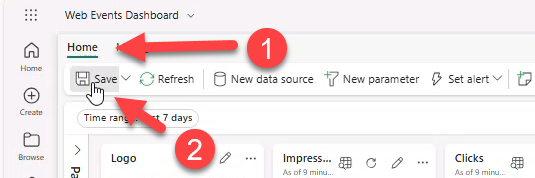
- Home → Save.
14. Data Activator
Create a Reflex Alert to send a Teams message when a value meets a threshold.
- On tile Click by hour → Set alert.
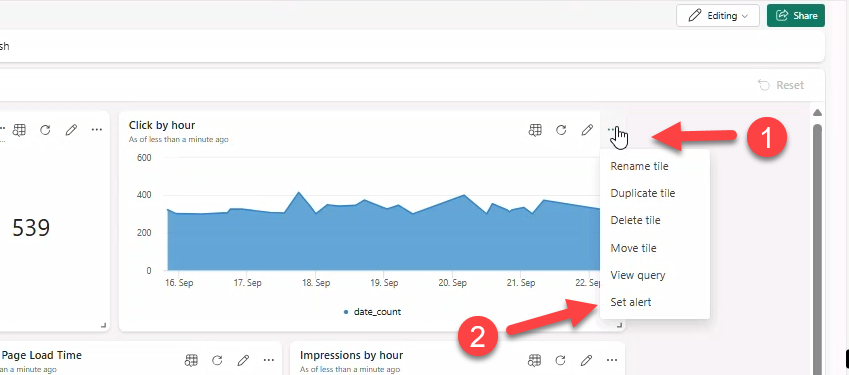
- Set values: On each event grouped by → event_date, When: date_count, Condition: Becomes greater than → value
250. Action: Message me in teams.
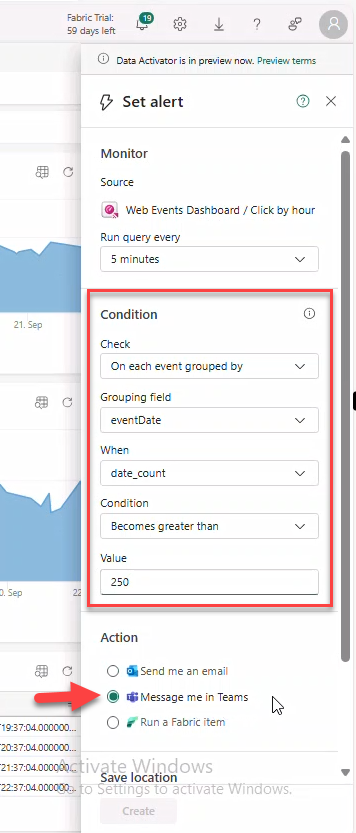
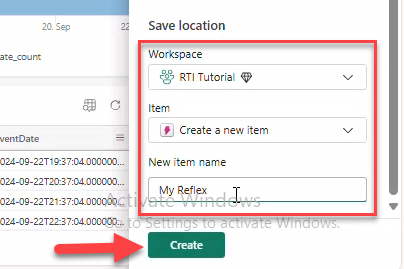
- Select Workspace → Create a new item → name
My Reflex→ Create.
Note
The Reflex item appears in your workspace and can trigger multiple actions.
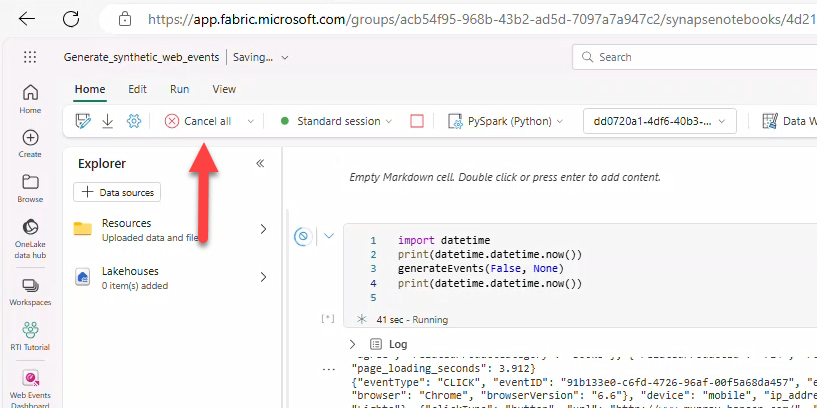
Stop running the notebook when done.
- Open Generate synthetic events → Cancel all.